Definition
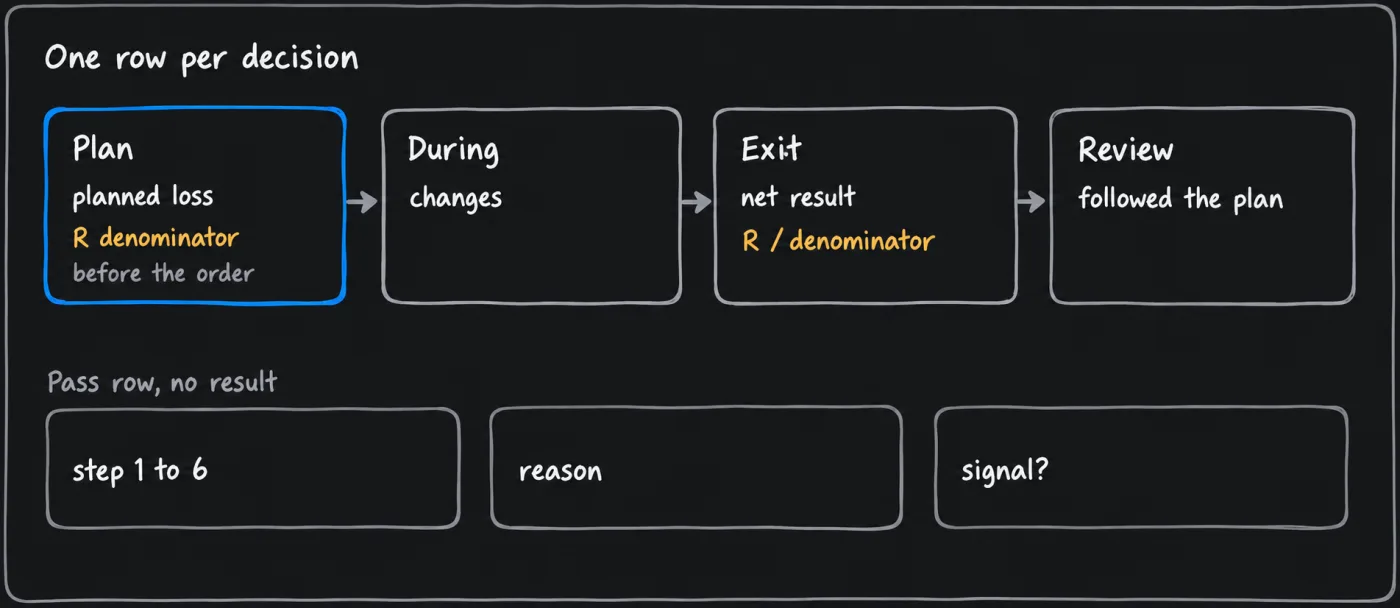
A trading journal is a dated record of every decision, the trades you took and the ones you passed on, with enough fields to recompute each result and check each rule. Keep one row per decision, written in the order things happen: plan, fill, exit, review.
It answers two questions that one result cannot. Did you follow the plan you wrote? That is answered from the page, trade by trade. Is the plan worth following? That needs many rows. Use the journal to decide whether a trade followed its plan, and later whether a setup has earned more trades.
How it works
What to record for each trade
Copy the tables into any format that keeps one row per decision. The plan fields are written before the order and are not edited afterwards; a change gets a dated note beside it. Each field marked Plan comes from a step of the decision cycle. One trade is one plan, from its first fill until the position is closed and any resting orders are cancelled, so a ladder or a partial exit is one row with several fills.
| Field | What to write | When |
|---|---|---|
| ID, date and time (UTC), record type | A number; live, paper or replay | Plan |
| Exchange, contract, direction | Long or short | Plan |
| Setup and version | The page it follows, or "none", and the version of its rules | Plan |
| Chart state | A screenshot with timeframe, levels, stop and target marked, plus the trend in a word | Plan |
| Trigger and invalidation | The trigger as something visible, and the invalidation price with the level it sits beyond | Plan |
| Planned entry, stop, target, size | Prices with the stop buffer included, order types, units; each rung if you ladder | Plan |
| Planned loss | In cash and as a share of equity, with the cost allowance per unit; planned reward to risk net of costs | Plan |
| R denominator | The plan's planned loss, cost allowance included, written before the order; for a ladder, the whole ladder's. Partial fills and exits do not change it | Plan |
| Rule checks | The value and a yes or no for each limit on the risk limits page, such as the planned loss share, the leverage setting and the total open planned loss | Plan |
| Changes | Each stop move or partial exit: price, units, and the reason from the plan | During |
| Exit reason | Stop, target, trail, close rule or other | Exit |
| Net result | Exit minus entry price times units for a long, entry minus exit for a short, summed over the fills, minus fees, plus funding received or minus funding paid. Slippage is already in the fill prices | Exit |
| R | Net result / R denominator | Exit |
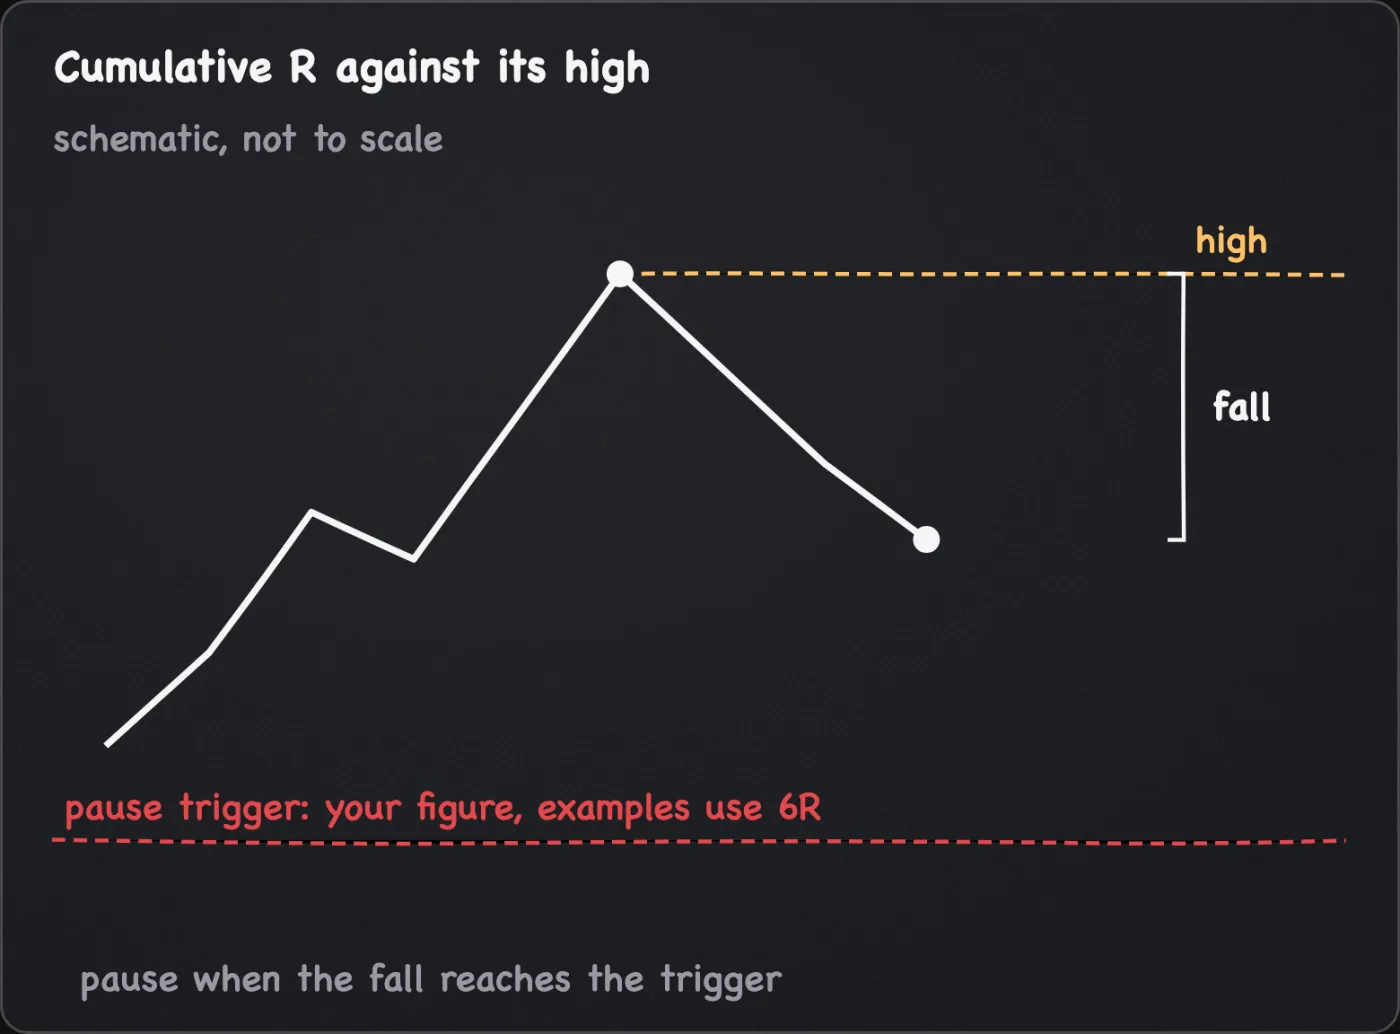
| Account | Balance after the close, cumulative R and its highest value so far, and the fall from it | Exit |
| Followed the plan | Yes or no; if no, which step and which rule; an exit screenshot | Review |
| One line | What the trade shows about the plan, not about the market | Review |
Every fill, entry or exit, gets a line in a fills table: trade ID, time, entry or exit, units, price, fee. Record slippage against the planned price in its own column, not in the result. Keep deposits and withdrawals out of the balance column and log them apart, or the drawdown will move for reasons that are not trading.
Passes and unfilled plans go in a second table, kept apart from the R record because they have no result.
| Field | What to write |
|---|---|
| Date and time, coin | When you decided |
| Kind | Pass, or a plan whose orders never filled |
| Step it ended at | One of steps 1 to 6 (review never ends as a pass) |
| Reason | The rule or condition, written before any order |
| Signal on the chart? | Yes if the rules fired and you skipped it, with the rule that skipped it; no if nothing met the reason |
| Chart state | A screenshot with levels marked |
Log a pass the moment you decide it. A pass whose reason is written later can be bent to fit what price did.
From the log to expectancy and drawdown
The fields are enough for the arithmetic on the expectancy and drawdown page. p is the share of rows with an R above zero, W their average, and L the average size of the rest, zeros included. Then E = p x W - (1 - p) x L. Drawdown comes from the balance column, in cash terms. The pause trigger comes from cumulative R and its high. With R fixed at each plan's planned loss, cumulative R moves with cash, though the two drift apart as the balance changes, so read the pause from cumulative R and the drawdown from the balance. A gross R from the chart usually overstates a row, so the net figure is the one to keep.
How to review the log
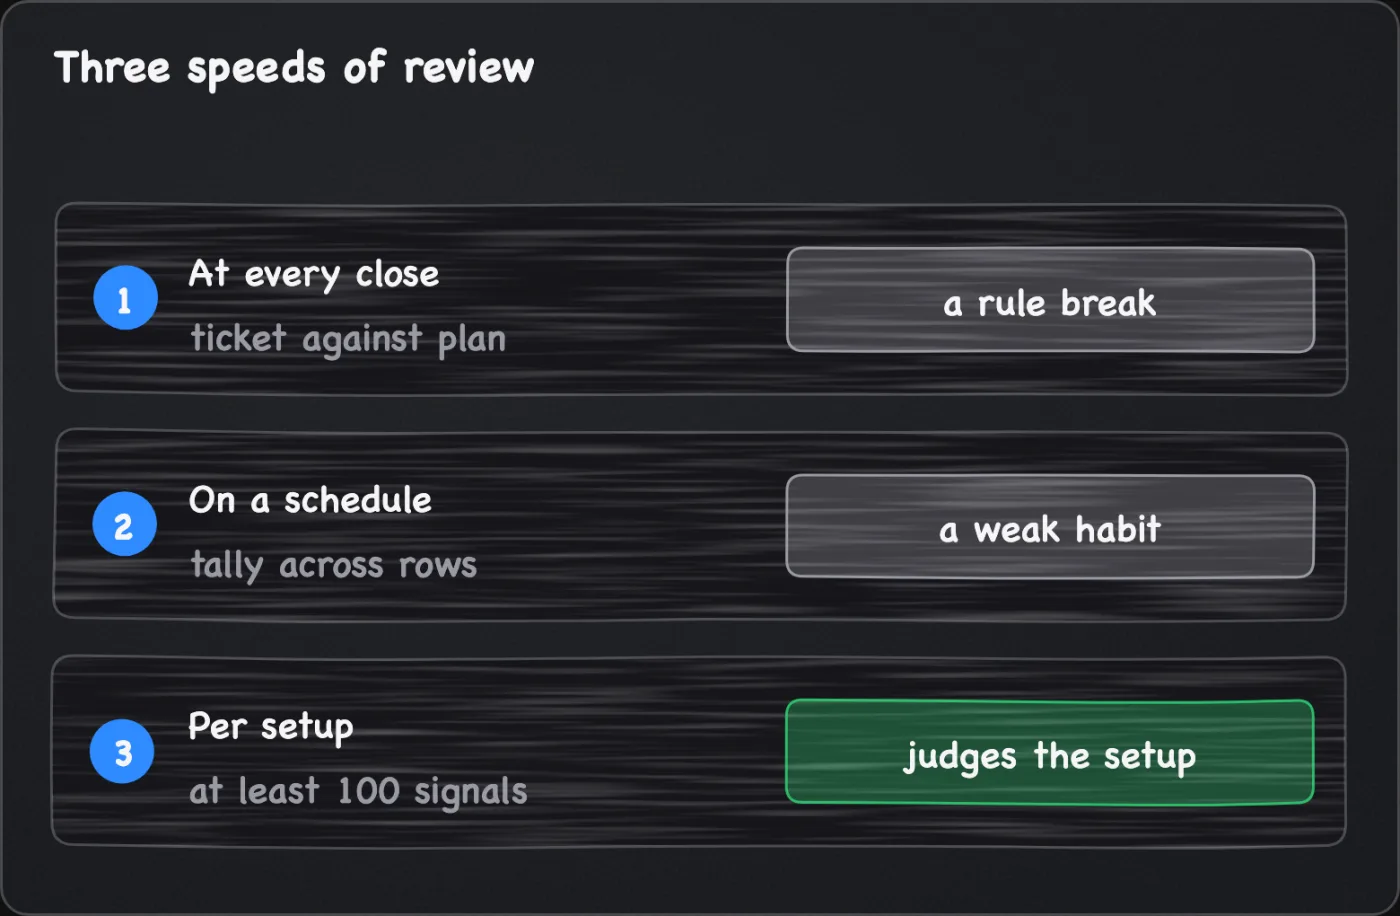
Review at three speeds, and only the third judges a setup.
- At every close, against the plan. Set the ticket beside the plan field by field: entry, stop, size, target, exit rule. Write yes or no, and for a no, the rule broken. A win that skipped a step gets the same review as a loss.
- On a schedule you set, across rows. The examples assume weekly. Tally the rule breaks by type. Compare the cost on each row with the allowance, and count the stops that filled past their order price, from the slippage column. Count the passes by reason, and look for signals skipped with no rule behind them. This finds a weak habit. It does not rate the setup.
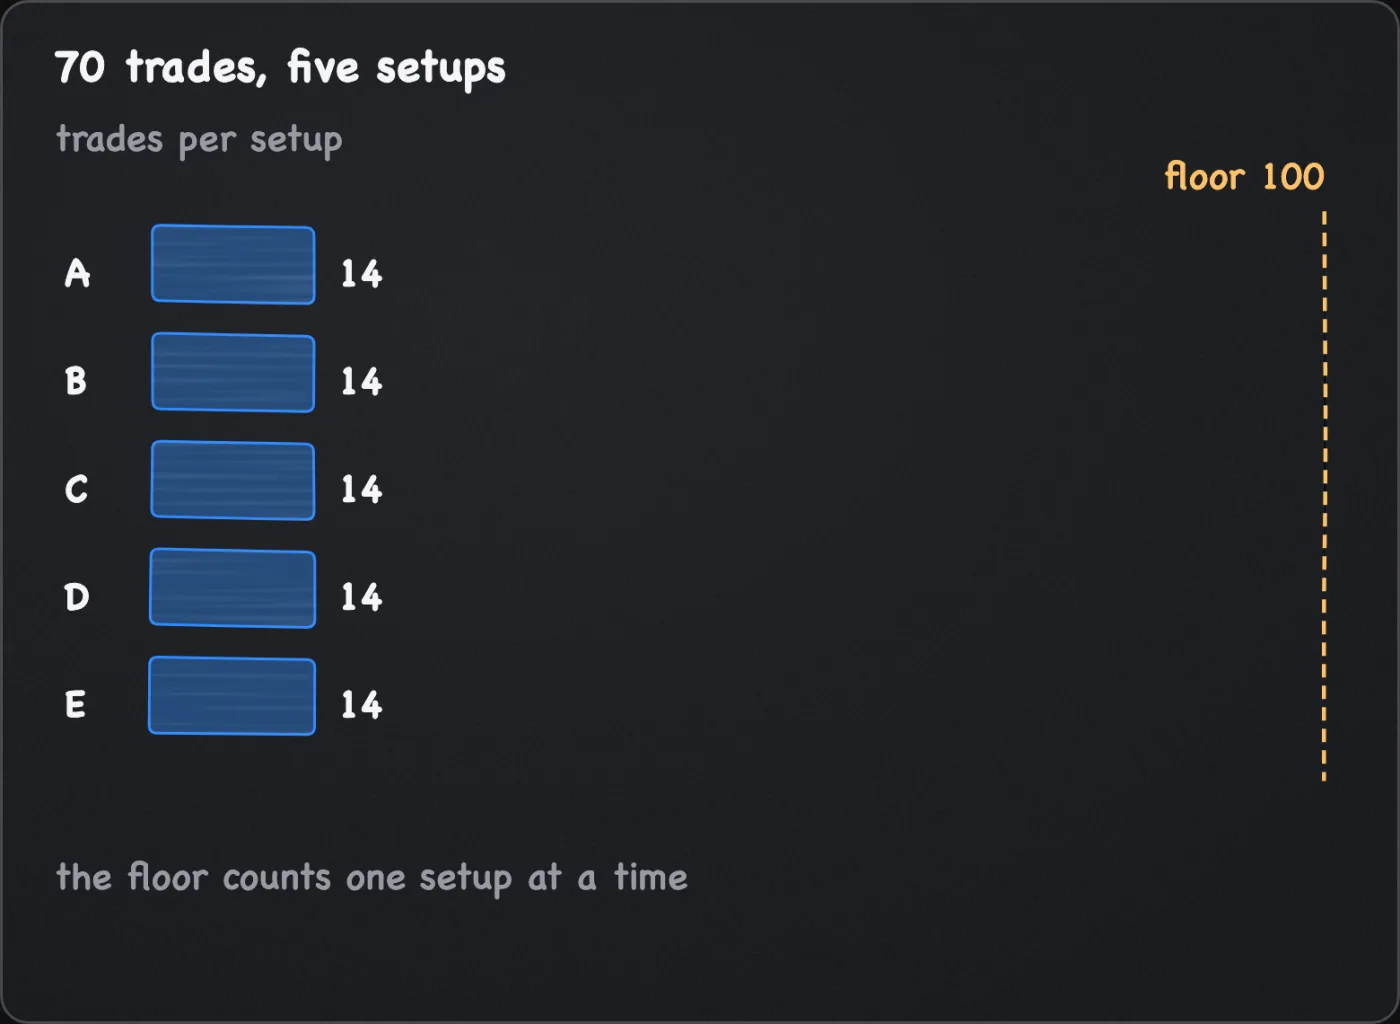
- Per setup, after enough rows. This manual's floor, from testing a setup, is at least 100 signals of that setup taken and recorded in R. It is a floor and not proof. If the true share of winners is 0.40, the observed share on 30 trades would typically fall within about 0.22 to 0.58, and on 100 within 0.30 to 0.50. Seventy trades spread over five setups is 14 each. Compare the result with the pass criteria you wrote before you started, not ones chosen after.
Changing a rule because of a review makes a new version that starts a new count. Review and practice covers testing a changed rule before you adopt it.
Default settings
This page cites no published default for a journal, so the table lists the reference values this manual uses.
| Item | Value | Status and limitation |
|---|---|---|
| What is logged | Every decision, passes included | This manual's choice. Logging only trades hides the decisions not to trade. |
| Unit | R, realised and net of costs, with planned values beside it | This manual's choice. Mixing planned and realised R hides what slippage costs. |
| Plan fields | Written before the order, never edited | This manual's choice. A reason added after the result bends toward it. |
| Count before reading a setup | At least 100 signals of that setup taken and recorded in R | This manual's choice, a floor. The range is still wide at 100. |
| Pause trigger | Your own figure, set in R before you trade; the examples assume 6R | The pause rule is this manual's choice. The trigger is yours, and 6R is an example, not this manual's figure. |
| Review schedule | Every close for the plan; the examples assume weekly for the tallies | Illustrative assumption. Set your own in the plan. |
How it is used in this manual's setups
The journal is the review step of the decision cycle, and the rules checklist asks for a row per decision with R net of costs and a reason for every pass. A test of a setup logs the same columns, so a test record and a live record read alike.
Common mistakes
- Logging only the trades. The passes and the plans that never filled are part of the record.
- Writing the reason after the result. Write it before the order, or the log records a story.
- Recording R gross of costs. Net the fees and funding on every fill, with slippage already in the prices.
- Editing the plan fields. Add a dated note instead.
- Reading a setup from a short record. Use the count above, and the range it implies.
- Reviewing only the losses. A win that broke a rule is a rule break.
What this cannot tell you
- That the plan works. A journal records choices and outcomes. At a small count it cannot separate a sound plan from luck, and a stop-out at -1R can come from either.
- What you did not write. A trade left out, a stop moved without a note, or a reason added late makes the record look better than the trading was.
- Why you broke a rule. The log shows that you did and which one. The cause is yours to find.
Questions
What should a trading journal include?
Per trade: the plan before the order, the actual fills, the exit and its reason, the result in R net of costs, a chart screenshot, the rule checks and whether you followed the plan. Per pass: the step, the reason and a screenshot.
How many trades before I can judge a setup?
At least 100 signals of that setup taken and recorded in R before you read its expectancy, and more to separate a small edge from none. Before that, review whether you followed the plan.
Should I log trades I did not take?
Yes. Log each pass with its reason and keep it apart from the R record. Skipped signals with no rule behind them are worth counting.