Chapter 4 ended on one question: on this chart, at what price would an idea on each coin be wrong? Market structure helps you answer it with three marks per coin: the larger chart's trend, the bands where price has turned, and the close that would end an idea built on a band. Fibonacci and waves are optional, discretionary extras.
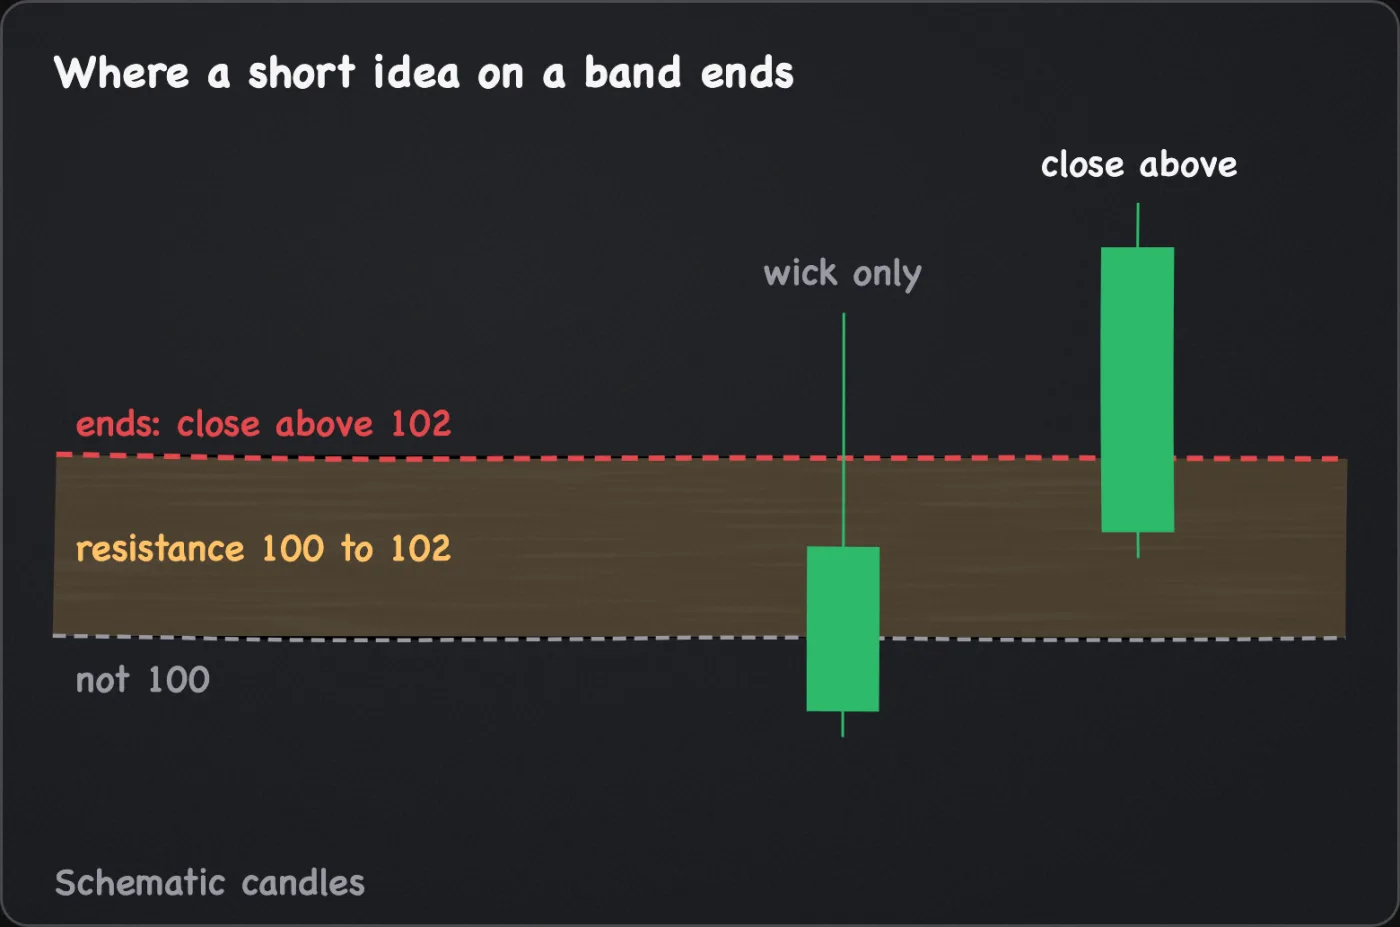
A level is not a place where price must react. It is a price you pair with an idea: if the idea rests on this band, a close beyond it ends the idea, and you write that first. A level drawn afterwards can always be made to fit, and a line moved after every break can never be broken. So date the map, make it on the larger chart first, fix width, touch count and close rule before the next candle, then carry each band down to the decision chart and re-mark it there. This manual draws bands because turning points rarely land on one price. For arithmetic only, a resistance zone from 100 to 102 ends a short idea at a close above 102, not 100. The limit: a map describes past turns, two traders mark different bands on one chart, and this manual cites no test of marked levels against chance.
| Line | What you write | Test it must pass |
|---|---|---|
| Coin and charts | The symbol, the template's context and decision timeframes, and the date. | Could you tell next month which candles it was drawn on? |
| Trend | One word for the context chart: advance, decline, range or unclear. The swing rule behind it, including how a swing is confirmed, and what would change the word. | Is the rule written, and was the word taken from closed candles only? |
| Key bands | The nearest band above price and the nearest below, then any other a plan will need. Each as two prices, with its chart and date. | Were the band's width and touch count fixed before the next candle? |
| Invalidation points | For each kind of idea a band could serve, the decision-chart close that ends it by your close rule: for a trade off the band, a close beyond its far side; for a break trade, a close back through the band to the side price came from. | Is each one a close on the decision chart, written as a price, not a wick? |
| Fibonacci lines or wave count (optional, discretionary) | Blank is a complete entry. If used, anchor prices written before the pullback ends, and for a count a second count and the price at which you switch to it. | Is the rest of the map still usable with this row crossed out? |
Objectives
This step supports the observe step of the decision cycle: what each coin on your list is doing on your two charts, and where an idea on it would be wrong. It comes here because conditions, plans and stops are all read against levels. It uses the template and the dated watchlist from chapter 4: each map is drawn on the template's two charts.
- Write a coin's trend on the context chart in one word, with the rule and what would change it.
- Mark a support or resistance band from swing points and record its two prices.
- Carry a band onto the decision chart and write the close that ends an idea built on it.
- Say what makes a break count and what a retest can and cannot show.
- Say what a Fibonacci line or a wave count adds to a map, and why the map stands without them.
The pages give conventions: a band runs from where bodies cluster to the furthest wick tip, two touches make a candidate and three are a common threshold, and a close is a finished candle's closing price on the decision chart, so a wick alone does not count. A close beyond the band is the usual convention and the rule the stop-loss placement page uses; the breakouts page lists a buffer or two closes in a row as variations. A retest is price coming back to a broken level from the other side, and one that holds is one observation, not confirmation. Fibonacci lines and wave counts are optional and discretionary: most ratios come from a number sequence (0.5 is the halfway mark), and two careful traders can anchor or count one chart differently. Use a line when a plan wants a place to check a pullback for a reaction, and a count when an idea is about which leg a move is in. A Fibonacci line never sets a stop; a count names the price where it is wrong, and any stop still goes beyond that level with a buffer.
Hypothetical walkthrough: one coin mapped, one left unclear
Hypothetical walkthrough. Invented prices and an invented outcome, chosen to teach the decision. Not a recorded trade, and not evidence of how often this setup works.
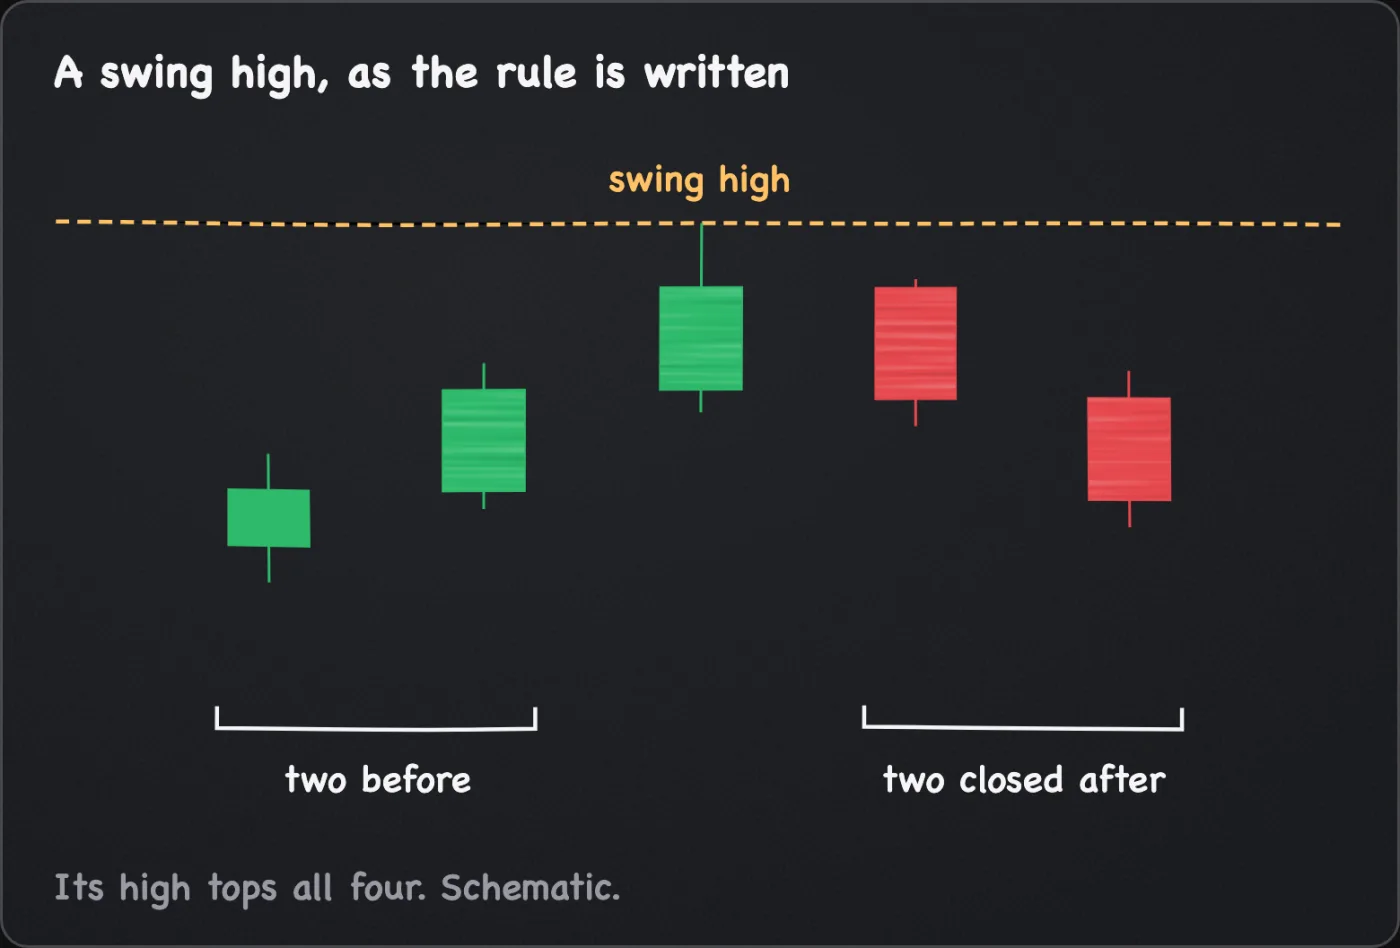
Assume the reader from chapter 4, with a weekly context chart, a daily decision chart and two coins. Their trend rule, written before they open a chart: a candle is a swing high if its high is above the highs of the two candles before it and the two closed candles after it, with the mirror for a swing low. Advance means the last swing high and swing low on closed weekly candles are each above the one before. Decline is the mirror, range is price turning between two bands, and anything else is unclear. A weekly close below the last swing low moves an advance to unclear, the market cycles page's example of a change condition. Bands use that body-to-wick convention and need three touches.
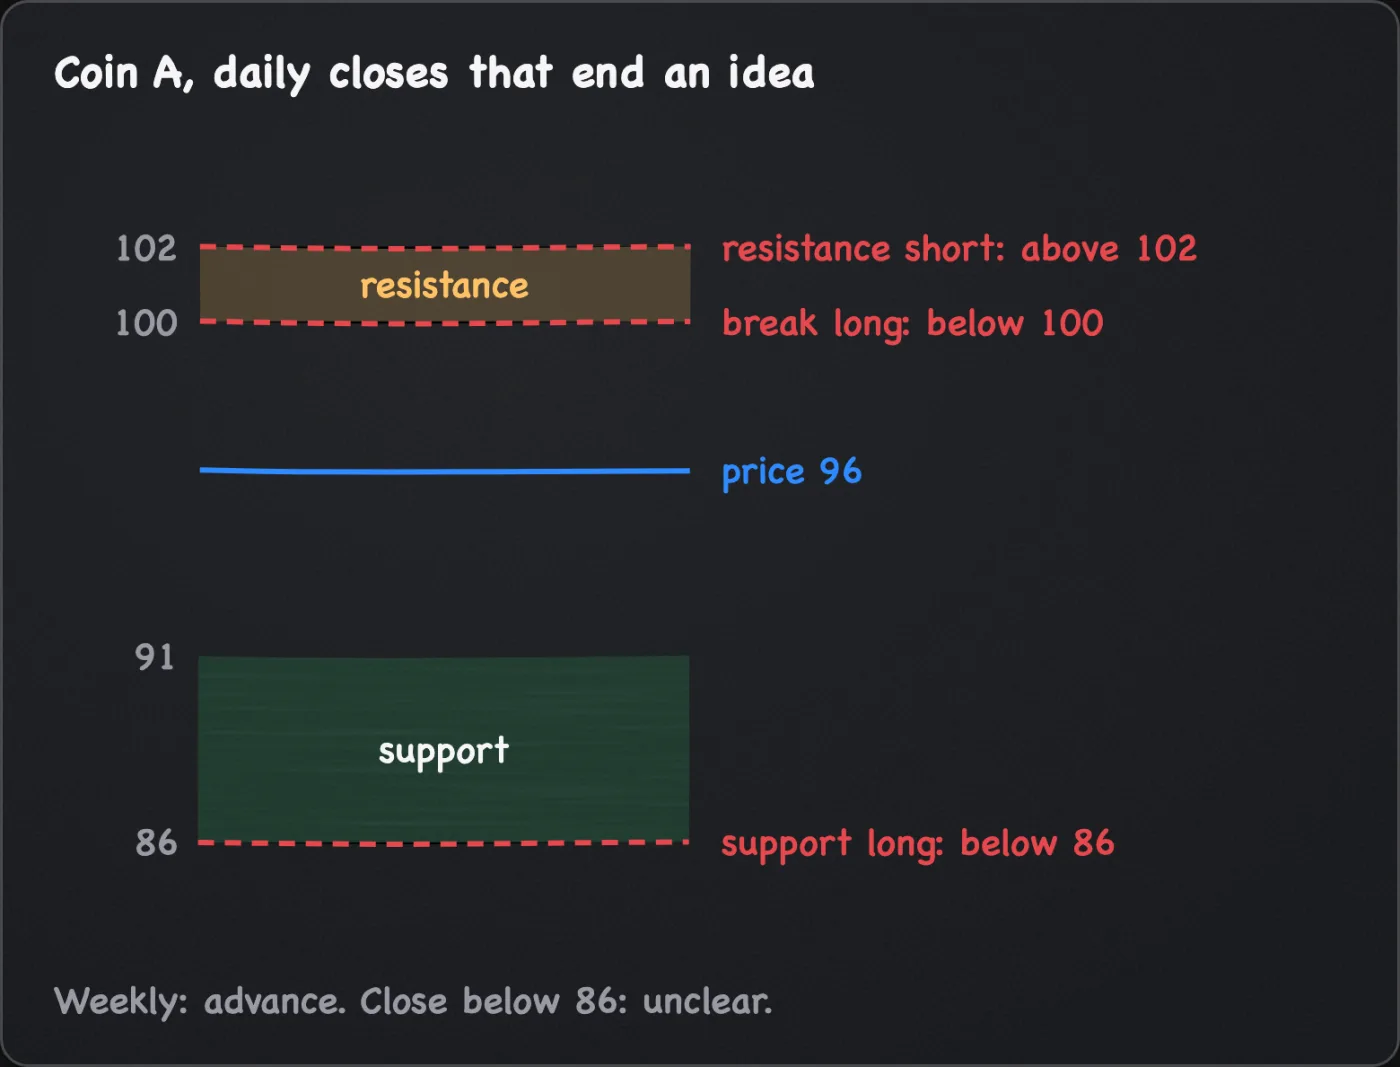
Coin A, at an assumed 96. Weekly swing highs are 95 then 108 and swing lows 80 then 86, so the word is advance, and it becomes unclear on a weekly close below 86. On the daily candles they re-mark the weekly low with the same width rule: bodies cluster at 91 and the lowest wick is 86, so support is 86 to 91. They find resistance at 100 to 102. Each band has three touches and is written as two prices with the date. Three kinds of idea could rest on these bands, and the map writes the end condition for each in advance. A long off the support is wrong on a daily close below 86. A short off the resistance is wrong on a daily close above 102. A long that waits for a break above the resistance is wrong on a daily close back below 100, this reader's rule for a failed break. A plan, written later, picks one or none.
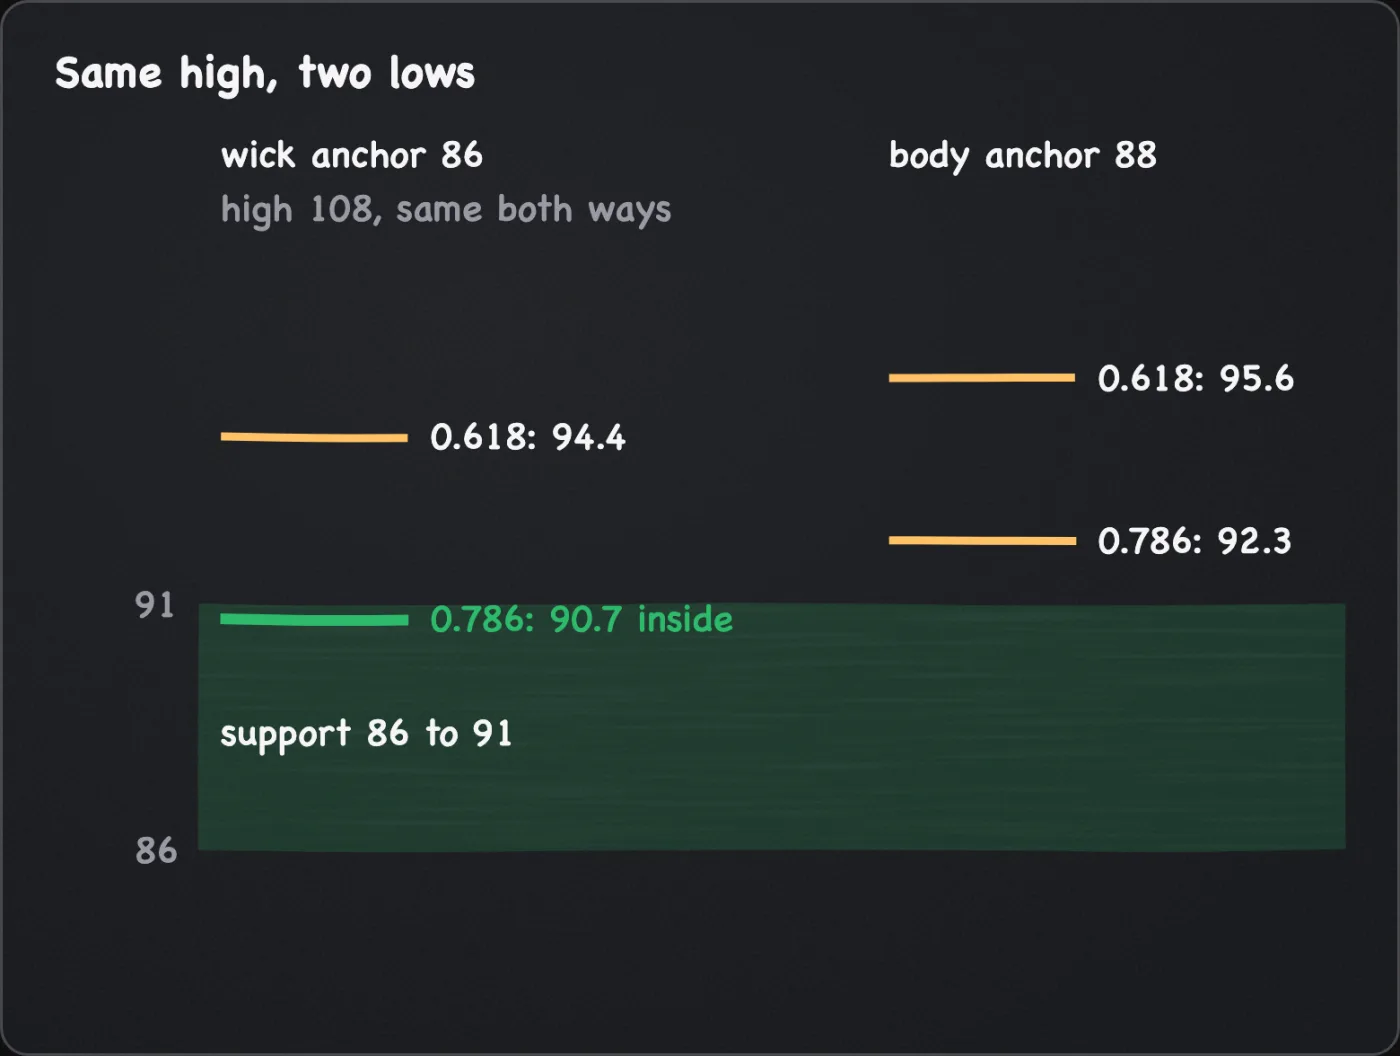
They try the optional row once, on the last leg, from the weekly swing low to the high at 108, rounding to one decimal. Price has already passed the 0.382 and 0.5 lines, so they read only the two still ahead of the pullback. The weekly low candle has a wick low of 86 and a body low of 88, and they keep the high at 108 either way. Anchored at the wick, the 0.618 line sits at 94.4 and the 0.786 line at 90.7, inside the support band: a second reason for a price already marked, not independent evidence. Anchored at the body low, they sit at 95.6 and 92.3, and neither lands in a band. Neither drawing says price will react. No idea has asked for a retracement level, so they cross the row out, and the bands and invalidations stand.
Coin B, at an assumed 61. Weekly swing highs are 60 then 66 and swing lows 52 then 48: the high rose and the low fell, which fits neither advance nor decline, and no pair of bands makes a range. The word is unclear. One band meets the three-touch rule, 58 to 60, and a long off it is wrong on a daily close below 58. Because the word rests on a sequence of swings, no single price changes it, so they write "reread at each weekly close; unclear until the swings fit advance, decline or range" and log "pass: trend unclear" for any plan that needs a trend.
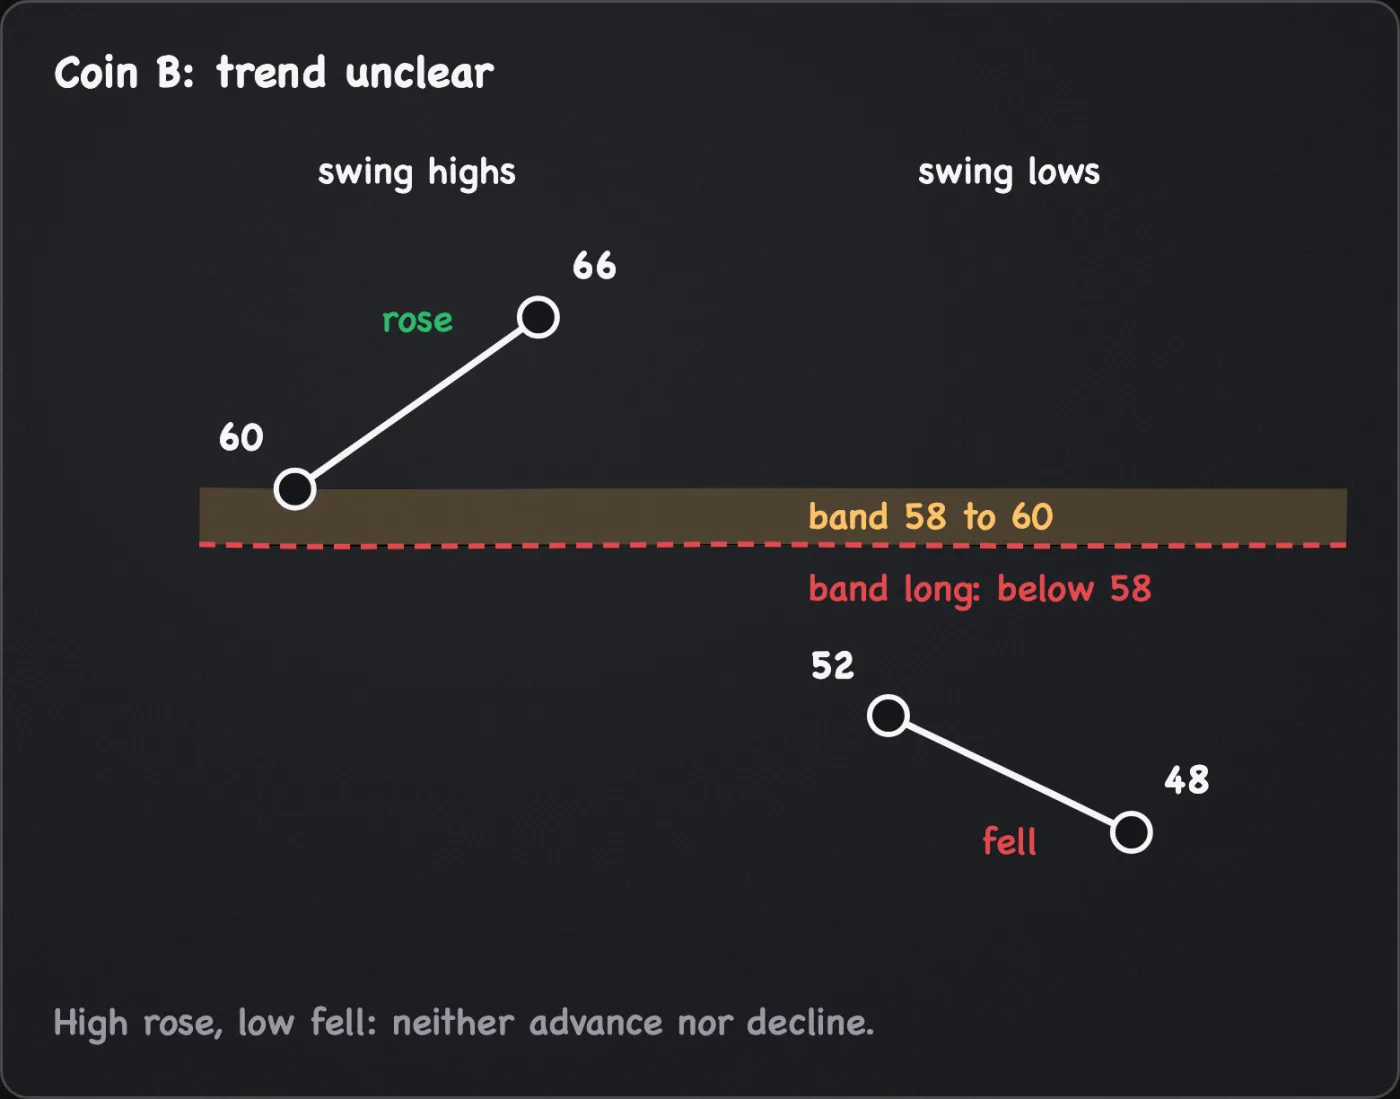
The outcome was chosen to show a finished map that contains a pass.
Reading list
- Market cycles: label the phase with a rule written first, on closed candles, with unclear as a fourth label.
- Support and resistance: marking a band from swing points and recording two prices with the chart and date, larger chart first.
- Trendlines and channels: the same discipline for a sloped line, with dated anchors and a break rule fixed before the candle closes.
- Breakouts and retests: what counts as through, how a breakout fails, and why a holding retest is one observation.
- Optional: Fibonacci retracement: where the ratios come from, anchors written before the pullback ends, and why a line is a place to look and not a stop.
- Optional: Elliott Wave: a way of labelling swings under three rules, and why a count needs a second count and a switching price.
Read the trend first, then bands, then the close rule, and draw each map before the next candle. The optional pages add candidate prices to a map that is already complete and move none of its band invalidations.
This chapter cannot settle whether a coin is worth a plan today. The trend word describes closed candles, and a band says where an idea would end. Neither says whether the coin's volatility and the room between bands allow a plan, or which setups that would allow, so two finished maps can leave open which plan, if any, to write. The invalidation is a close on the chart and the stop order a separate price set when a plan exists, so your risk budget sheet's stop-distance field still waits. The question to carry forward: what condition is each mapped coin in, and which setups does it allow? Trading market conditions takes that up.
You should now be able to
- Write each coin's trend word on its context chart, with the swing rule beside it.
- Draw each band on the context chart, then re-mark it on the decision chart with both prices and the date.
- Write the closing price on the decision chart that ends an idea built on each band.
- Beside each band, note what counts as a break and what a holding retest does not prove.
- Cross out the Fibonacci or wave row and check the map still works.
- Produce: your annotated level map for each watchlist coin (higher-timeframe trend, key bands, invalidation points), using the table at the top of this page.