Definition
Coins often move together, so several open positions can act as one larger position. Count total exposure by grouping the positions that tend to move together, adding their planned losses as if every stop in the group hit at once, and capping that sum before you open the next trade.
Correlation is a number from -1 to 1 for how two series of returns move together: near 1 they tend to move the same way, near 0 there is no linear link, near -1 they tend to move opposite ways. Use it to decide whether a new position adds a separate bet or more of one you already hold.
How it works
Each position is sized alone, and they add up
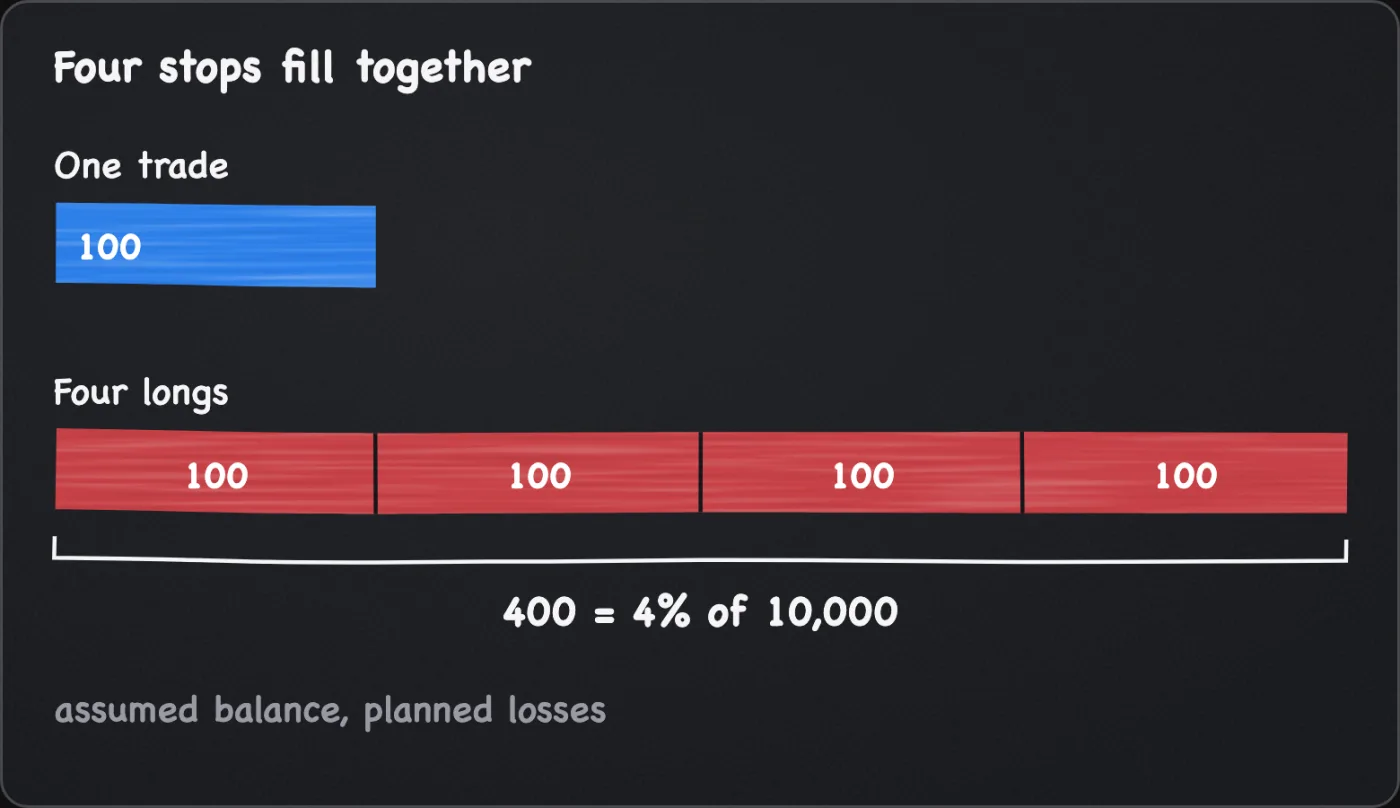
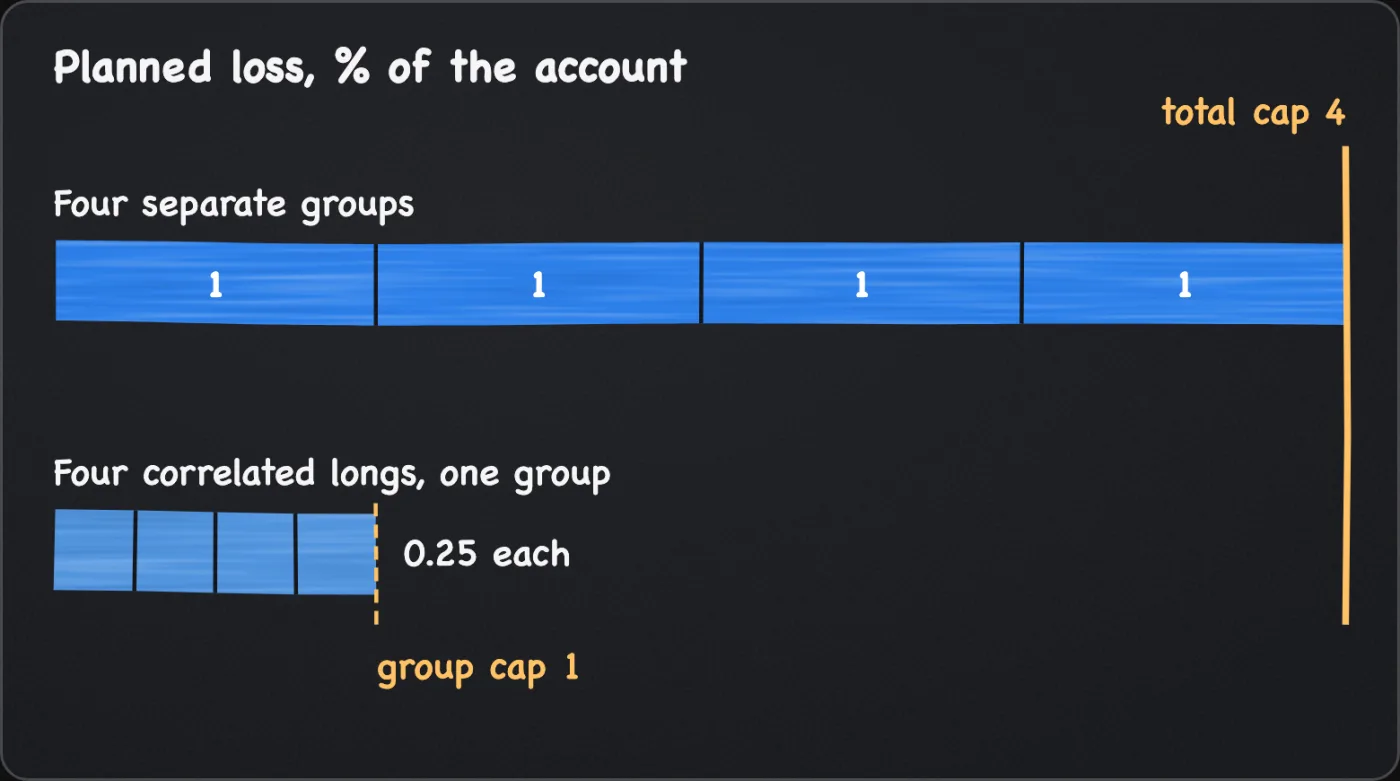
Position sizing sizes one trade from its own stop. It cannot see the other trades. For arithmetic only, assume a 10,000 account and four longs in four different coins, each with a planned loss of 1%, or 100. If the four coins move together and the four stops fill together, the loss is 400, or 4% of the account. Four small trades have become one trade four times the size, and that is the case to cap, because it is the one you cannot rule out.
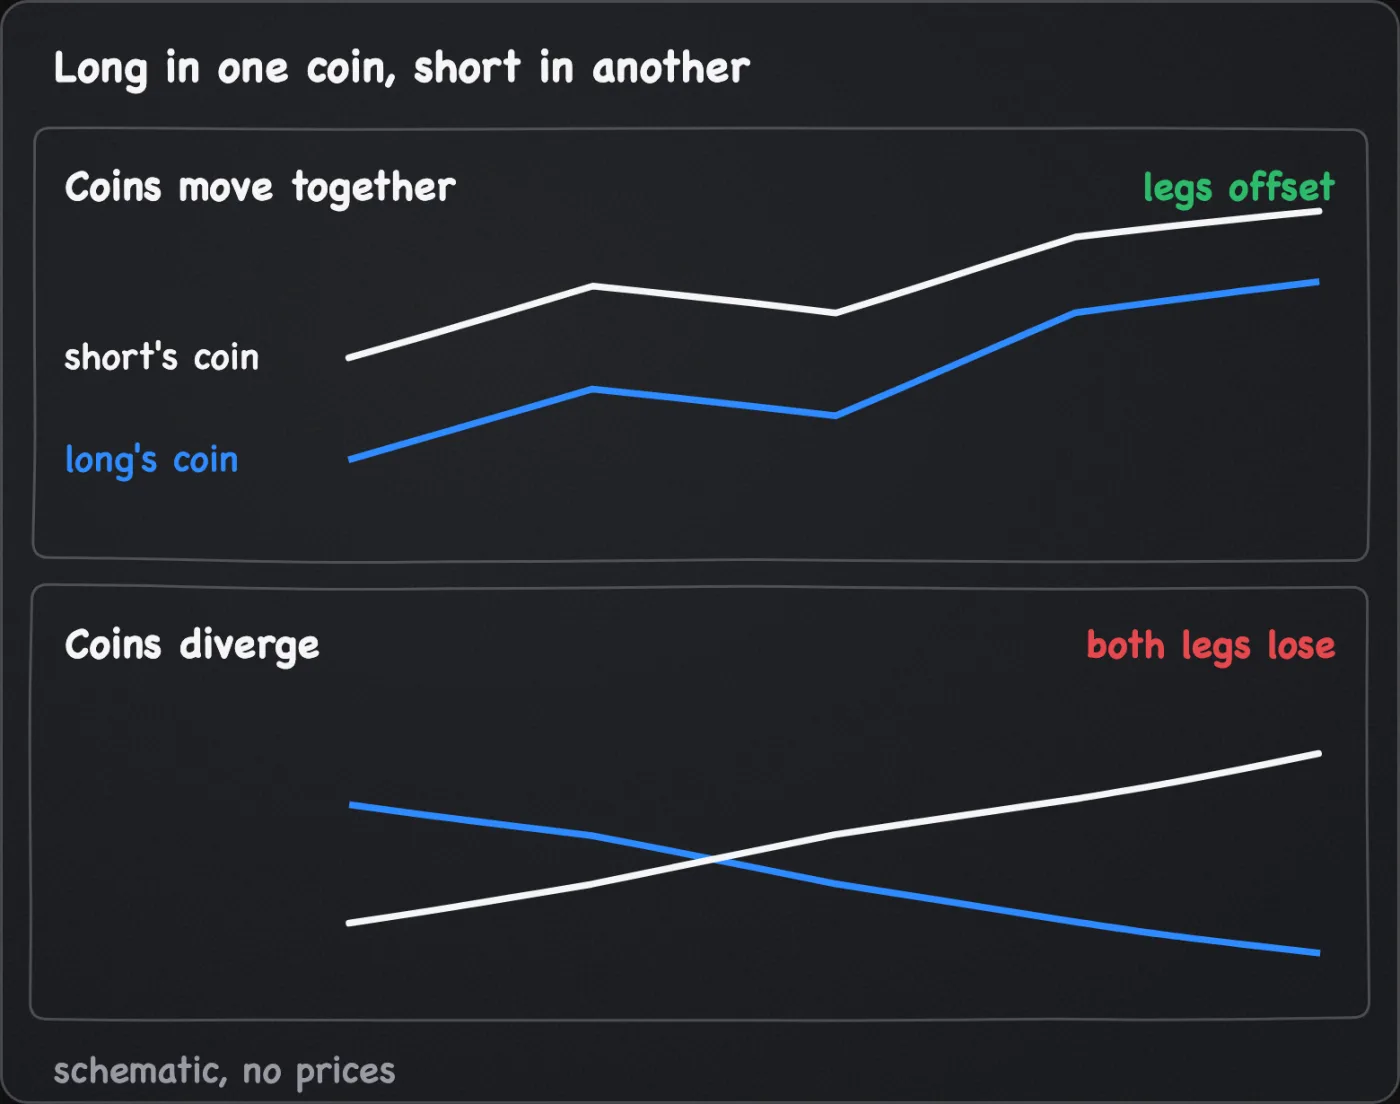
A long in one coin and a short in a correlated coin look like a hedge, and partly are. They offset when the two move together. They can both lose when the coins diverge the wrong way, as the long's coin falls and the short's coin rises, and fees and funding run on both. Count each leg's planned loss. Do not net them to zero.
Group before you add
- List every open position and its planned loss as a share of the account. The planned loss is size times the stop distance with its buffer, as sizing gives it, counted from the current price. A stop moved to entry produces about the costs, not zero, so count what it would produce now.
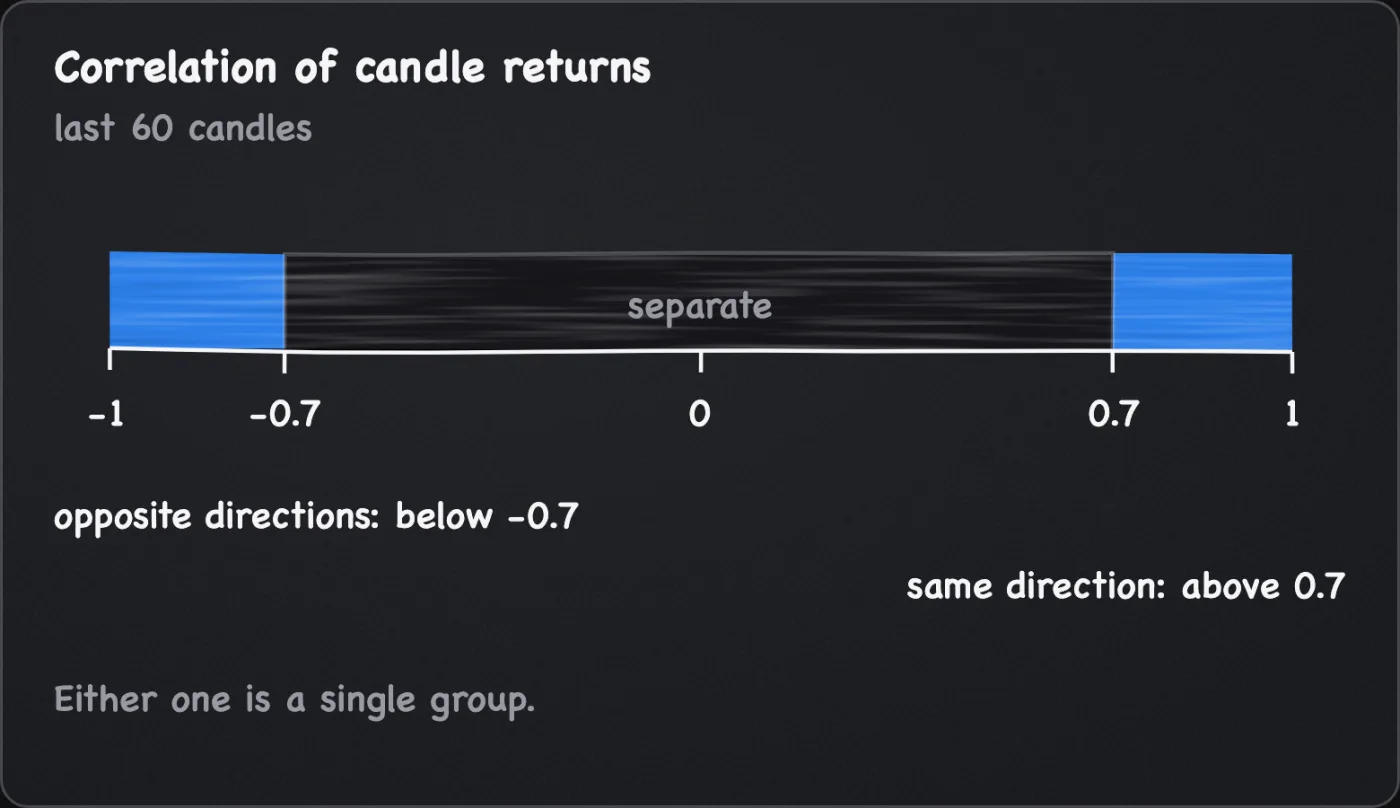
- Group positions that tend to lose together. That means same-direction positions in coins whose returns move together, and opposite-direction positions in coins whose returns move opposite ways. Check candle returns, not prices, on your decision timeframe over a stated window, such as the last 60 candles. Many charting platforms print a correlation coefficient for two symbols. This page cites no figure for how any pair of coins correlates, and the number changes with the window, so measure your own and recheck it.
- Add the planned losses inside each group, as if every stop hit together.
- Cap each group, then the total. The caps are in the table below.
- Add the position values and divide by account equity. The 3x ceiling from leverage applies to that sum as well as to each position's leverage setting.
A worked count
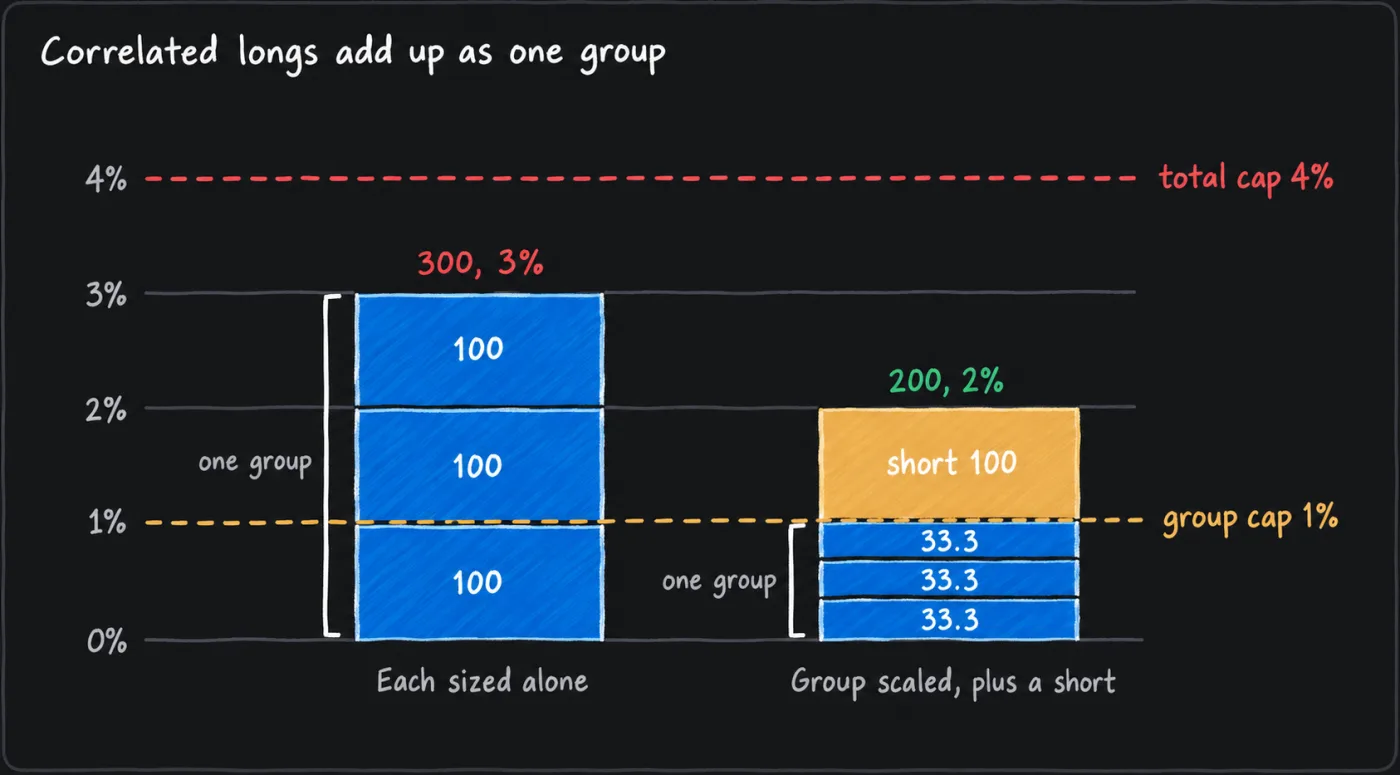
Assume the same 10,000 account, a per-trade limit of 1% and so a group cap of 1%. Three longs in coins that move together would carry 1% each, 3% in all, which is over the cap. Scale each to one third, 100 / 3 = 33.3 each, or keep the clearest idea alone. Passing on the other two is a valid result. Now add an unrelated short with a planned loss of 100, a second group at 1%. The total is 1% + 1% = 2%, inside a total cap of 4%.
Cross margin hides the sum
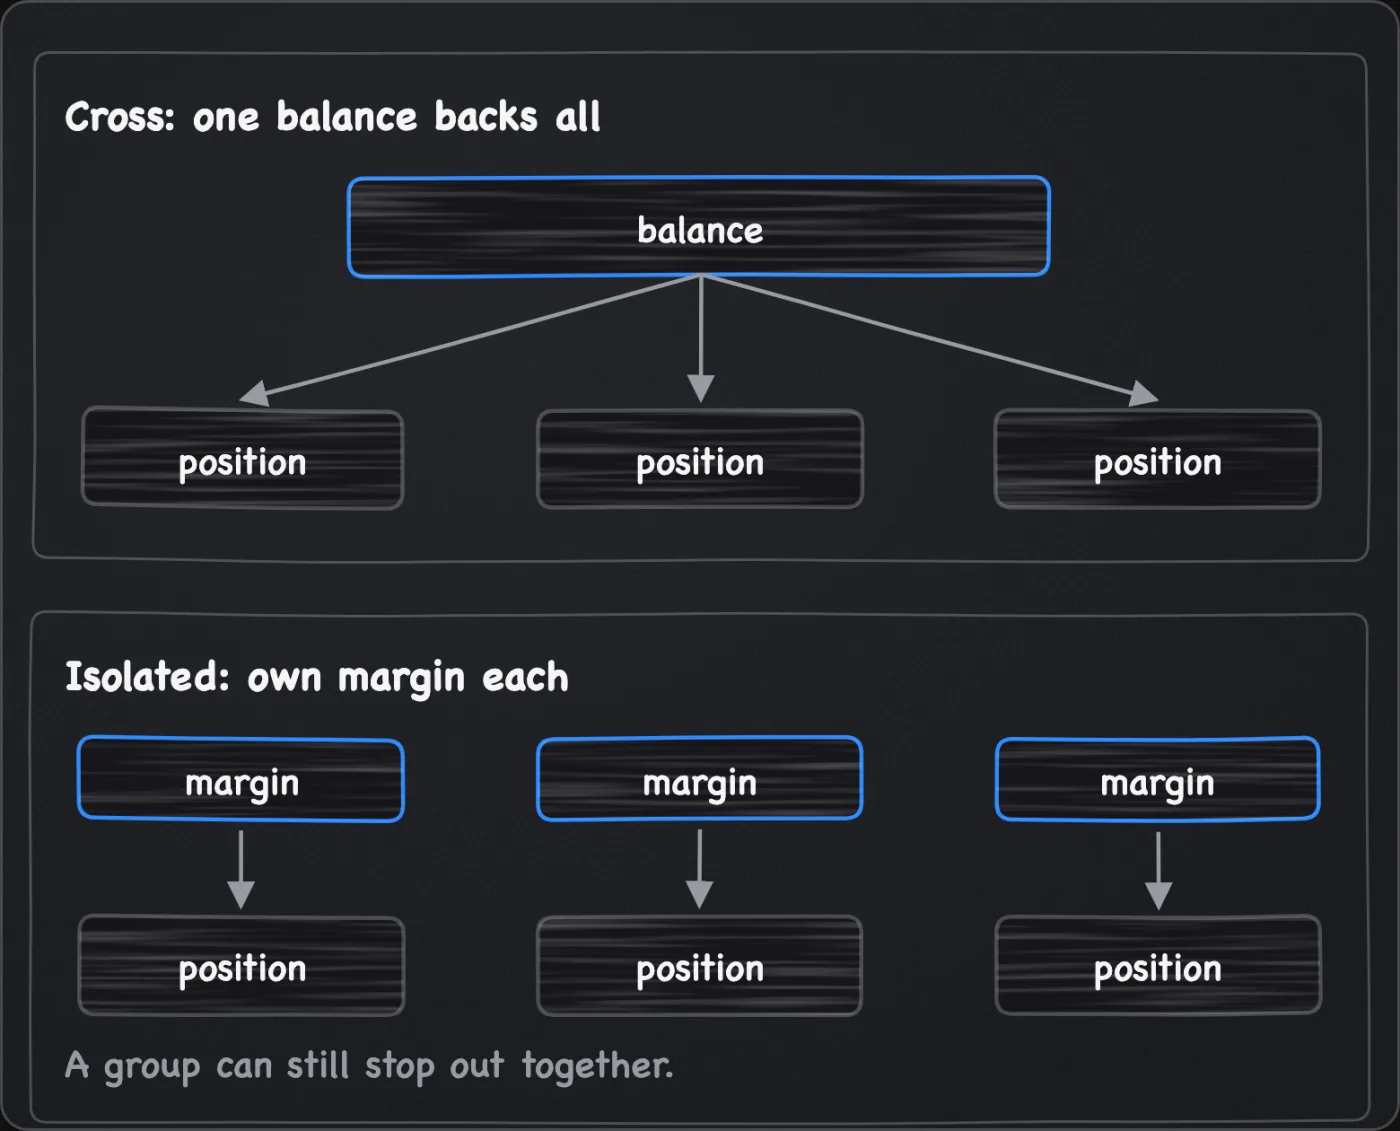
On cross margin one balance backs every position, as the liquidation price page explains, so correlated positions that all go wrong draw on the same pool. Isolated margin limits each position's loss to the margin assigned to it, but it does not limit the planned losses of a group stopping out together.
Volatility is a different question
Two coins can move together while one moves twice as far. Volatility sets each stop distance and so each size. Correlation is a rough guide to whether the stops may hit together. It is not a probability of it. You need both.
Default settings
This page cites no published default for these caps, so the table lists the reference values this manual uses. A widely cited 6% rule also caps total risk; this manual chooses a stricter 4%.
| Item | Value | Status and limitation |
|---|---|---|
| What counts as a group | Same direction with a correlation of candle returns above 0.7, or opposite directions with one below -0.7, over the last 60 candles of your decision timeframe | This manual's working line and window. A lower line groups more and caps harder. A higher one lets partly linked positions count as separate. If only some pairs in a set pass, treat the whole connected set as one group. |
| Cap per group | The per-trade limit you set, up to 2% of the account | House constraint, because it reuses the per-trade limit; a choice and not a recommended allocation. One group counts as one trade. Lower is allowed. |
| Cap on the total | 4% of the account, planned losses summed across all open positions | This manual's choice: two groups at the top of the range. Planned loss, so a gap through several stops can cost more. |
| Leverage ceiling | 3x, position values summed over account equity | House constraint, a choice. It caps total size, and each position's setting stays at 3x or below. Each position's liquidation price still has to be read from its own order ticket. |
| Variation: direction only | Treat every position in the same direction as one group | The simple fallback when you cannot measure. It caps hard and may refuse trades that were independent. |
How it is used in this manual's setups
Each setup sizes its own trade. The risk budget step of the decision cycle then adds a check against what is already open, using the count above. If the new trade would push its group or the total over a cap, size it down or pass. The risk limits page lists the caps as a checklist. A second short beside an open ending diagonal breakdown in a related coin is one group until you have measured otherwise.
Common mistakes
- Sizing each position as if it were alone. Add the group before you open the next one.
- Treating many coins as diversification. Count positions by group, not by ticker.
- Calling a long and a short a hedge. Count both planned losses.
- Skipping the liquidation check because the total is under 3x. Read each position's liquidation price on its ticket.
- Measuring correlation on a different timeframe from the one you trade. Use the decision timeframe.
- Adding positions because earlier ones are in profit. The cap counts planned losses, not how the account feels.
- Reading cross margin as spare room. One balance backs all of it.
What this cannot tell you
- How coins will move together in the next fast move. Correlation is measured on past candles and changes with the window and the market. This page cites no measurement of how it behaves in a sell-off.
- That an uncorrelated position is independent. One event, such as a listing change, a stablecoin problem or an exchange outage, can hit positions that never moved together before.
- The realised loss. The cap sums planned losses, and gaps, slippage, fees and funding can make a group's realised loss larger.
- Counterparty exposure. Everything held on one exchange shares that exchange's failure, and this page does not size it.
Questions
Are crypto coins correlated?
Often enough that you should not assume they are not. This page cites no measured figure. Check your own pair, on your own timeframe, over a recent window.
How many positions can I have open at once?
As many as fit under both caps with each stop and size honest. At a planned loss of 1% each, four separate groups reach the 4% total, and four correlated longs count as one group, so each would carry at most 0.25% against a group cap of 1%.
Does a long and a short in two coins hedge each other?
Partly, while the coins move together. When they diverge both legs can lose. Count both.