What it is and when it applies
This page helps you decide whether to short the break of a rising wedge at the end of an uptrend, or to pass. The wedge is called an ending diagonal, and it forms as an uptrend runs low on buyers. Price keeps making higher highs, but each push up is shorter than the last, and each dip falls back into ground the trend already covered. Draw one line across the highs and another across the lows, and the two lines converge. This setup shorts the break below the lower line.
In Elliott Wave terms the wedge has five legs. Waves 1, 3 and 5 touch the upper line; waves 2 and 4 touch the lower one. The pattern only appears at the end of a move: wave 5 of an impulse, or wave C of an A-B-C correction. It never forms as a third wave, so a wedge in the middle of a move is a different pattern or a wrong count. Elliott Wave practice reads the break as the start of a fast move back toward where the wedge began. That is a story about a pattern, not a promise: price may never get there, and this page cites no test of how often it does.
It fits a coin that has trended up for some time and now grinds higher with less force. It does not fit a vertical, parabolic run, a coin that has gone nowhere for weeks, or a thin market where one large order can push price through your lines. The volatility scanner helps you spot the vertical runs and the coins that have gone nowhere; check the order book for a thin market.
This is a discretionary wave approach, one way among several to plan a short. A count is a judgment, and two careful traders can label the same chart differently. The stop below is a price, and the idea is wrong there whether or not the count is.
Before you enter
The short is wrong if price climbs back over the top of the pattern: above the wave 5 high, or above the failed bounce high if you enter after the break. The wedge may be unfinished or the count wrong, and either way the reason for the short is gone. A stop inside the wedge sits where ordinary swings will reach it. The stop order goes at that level plus a buffer. The examples assume 0.5 x ATR(14), an assumed figure and not a rule: a wider buffer takes a bigger move to reach and shrinks the position, and a tighter one does the reverse.
Size the position from the distance between your entry and that stop order. This manual's house constraints are a planned loss of 1-2% of the account per trade and 3x maximum leverage. They are choices, not a recommended allocation, and less, or no position, is always allowed. Sizing inputs:
- Account risk: the planned loss in cash, 1-2% of equity or lower.
- Entry price: the assumed fill.
- Stop price: the level above plus the buffer.
- Cost allowance: an amount per unit for fees and slippage, added to the stop distance, plus funding for the planned hold (trading costs and liquidity covers it).
- Leverage cap: the leverage setting, and all open position values plus this one over account equity, 3 or less.
- Liquidation distance: the ticket's estimated liquidation price, above the stop for a short.
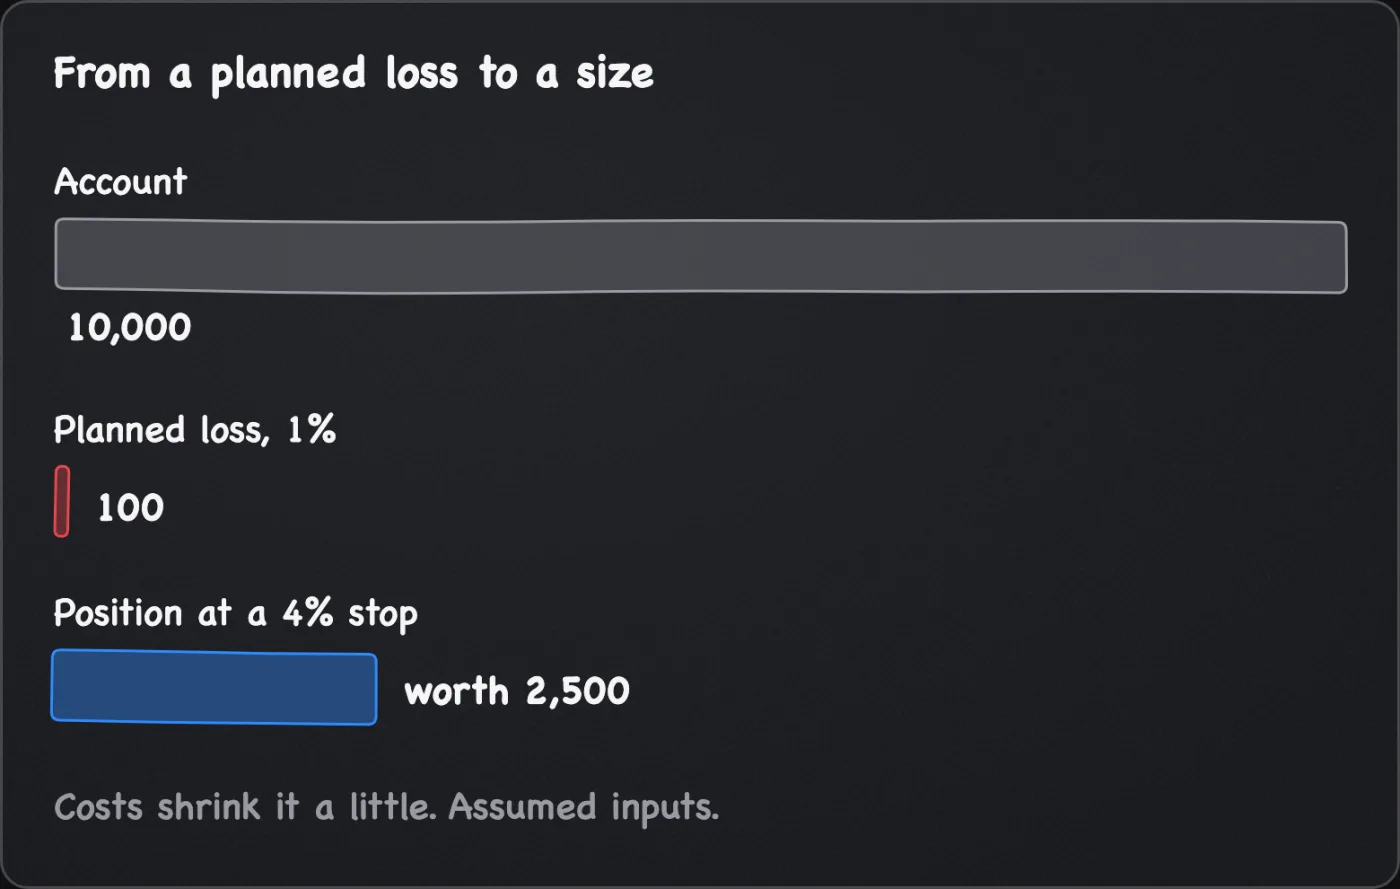
Divide the cash you are willing to lose by the stop distance as a fraction of price; the result is the position's value. For arithmetic only, assume a 10,000 account at 1%, so the planned loss is 100. If the stop order is 4% above your entry, the position can be worth 2,500, because 4% of 2,500 is 100. The cost allowance shrinks that a little. The position sizing page covers the arithmetic. That is the planned loss if the stop fills at its price. Slippage, a gap, fees or funding can make the realised loss larger.
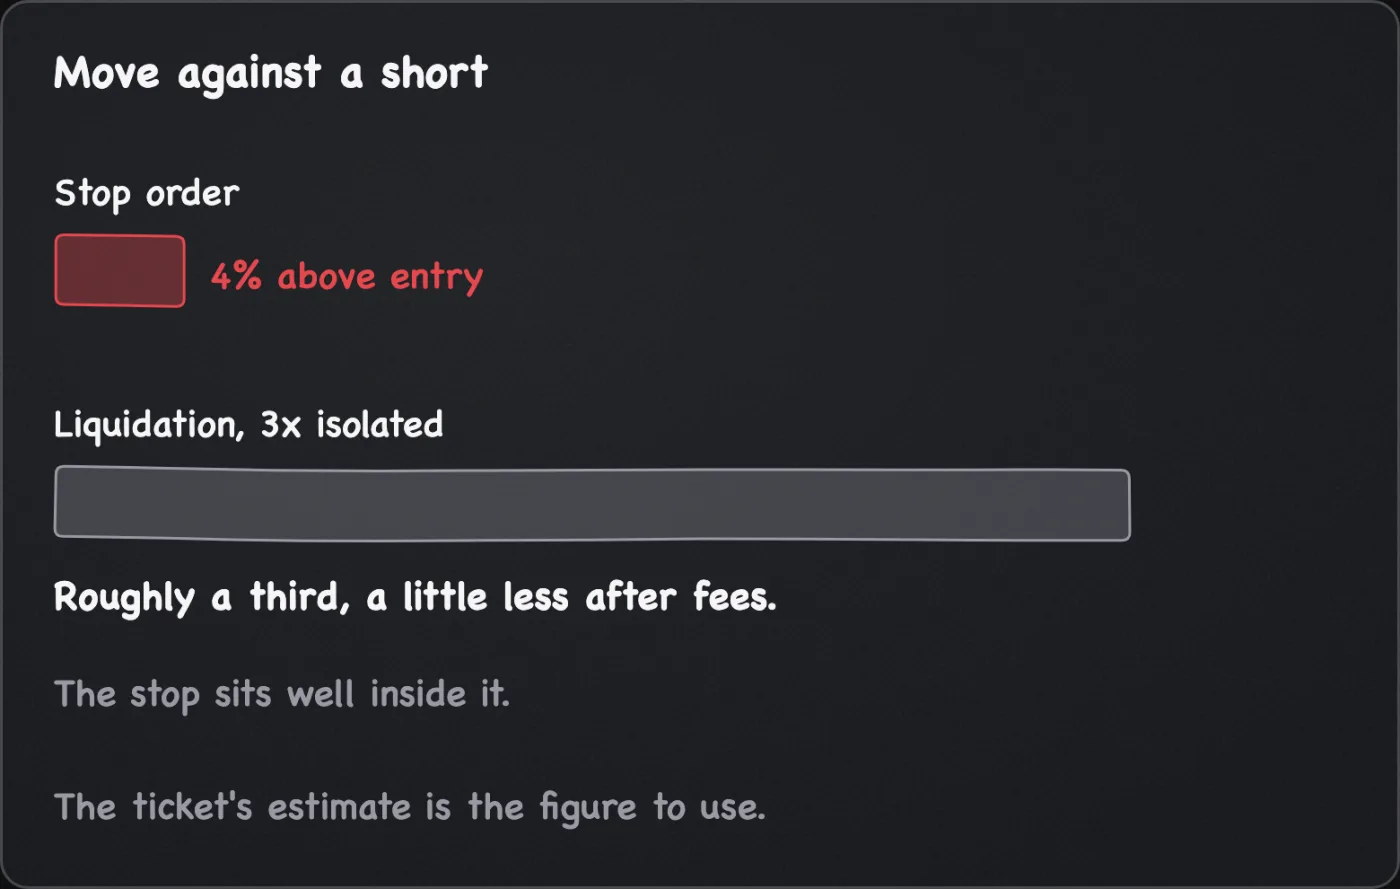
Leverage only supplies the margin for that position. It does not change the loss at the stop. On isolated margin at 3x, a move of roughly a third against you forces the position to close, and fees and maintenance margin make that distance a little smaller. Cross margin differs, and the ticket's estimate is the figure to use. A short against a strong uptrend can face a sharp spike, so the stop must sit well inside that distance. If the ticket's liquidation price is not well beyond the stop, lower the leverage setting.
A short's stop has to buy, so use a stop-market order and accept the fill price. A stop-limit with its limit above the trigger caps the fill price but can sit unfilled if price jumps past the limit. Write down the entry, stop, targets and reward to risk before placing any order. If one is missing, pass.
Conditions
- The wedge sits where a fifth wave or a C wave could end, after a clear move up. A wedge mid-trend does not qualify.
- Both lines slope up and converge. The lower line rises faster.
- Wave 4 drops into the price range of wave 1. In an ordinary impulse it would stay above the top of wave 1.
- The legs shrink, which is the contracting form this page covers: wave 3 is shorter than wave 1, wave 5 shorter than wave 3, and wave 4 shorter than wave 2. Wave 3 is then not the shortest of waves 1, 3 and 5.
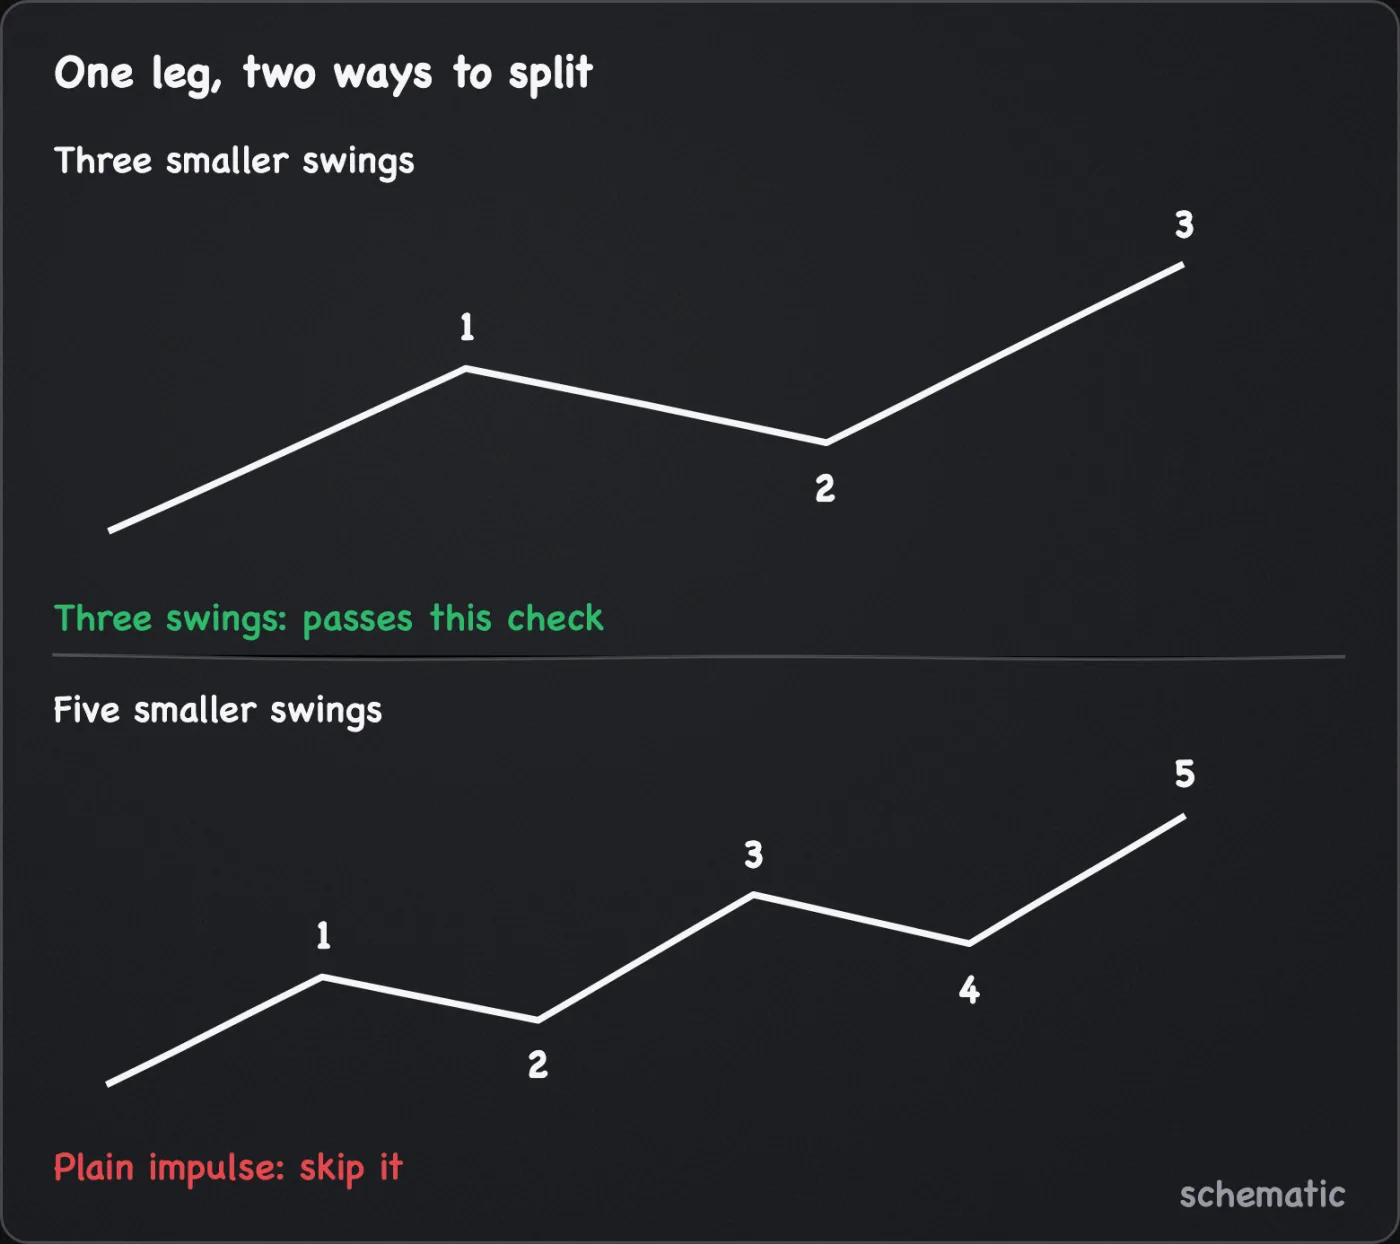
- Each leg splits into three smaller swings. Legs that clearly split into five point to a plain impulse, so skip it. Exact labels on every small swing are not required.
- The lines run through candle bodies, not the furthest wicks (see trendlines and channels). A wick over the upper line is not a close beyond it, so by this setup's rule it does not break the pattern. It can be a failed push that traps late buyers. If the only line that fits cuts through many candles or needs an impossible count, redraw it.
- Momentum fades into the top. RSI peaks lower on wave 5 than on wave 3 (bearish divergence), and a lower-timeframe MACD histogram shrinks on the final push. Each is one reason among several, not a trigger.
- The top of the wedge meets real resistance, such as a prior high or an old support level that now caps price.
- The higher timeframe does not contradict the count. When the two disagree, this manual defers to the higher one, a choice, because a lower-timeframe wedge can be a pause inside a larger move.
Reasons to pass
Passing is a valid result. Pass when:
- the wedge sits mid-trend, or each leg clearly splits into five swings
- you cannot write a second count and say what it does to the plan
- the run is vertical, so the stop would need to sit so far away that the position is below the exchange minimum or too small to be worth managing
- costs come to more than one fifth of the planned loss, this manual's cost check on the risk limits page
- the book is thin enough that your own order would move price
- the higher timeframe count disagrees with the one you drew
Entry
There are three entries, ordered from most confirmation to least.
- Short the failed retest. Wait for a candle to close below the lower line, then for price to bounce toward the line or back into the wedge. Short when the bounce stalls and turns down; one rejection candle on a low timeframe often shows the turn. This is the retest entry.
- Short the break. Sell as a candle closes below the lower line. You keep more of the drop, but a retest into the wedge can reach a tight stop.
- Short a double top. If price makes a second, failed attempt at the wave 3 high, shorting there gets you in before the wedge breaks. That failed push can be a truncated fifth wave, with wave 5 stopping short of the wave 3 high, or it can be a pause before a higher top. Its stop goes above the double-top high plus the buffer. A push through that high is the ordinary wave 5 still running, which ends this entry, not the setup.
Shorting at the upper line before a break is the weakest choice, because the wedge can extend through one more leg. Each added step of confirmation gives up part of the drop, and can avoid a false start. Entering early gives more of the drop and less confirmation, and entering late does the reverse, so decide which trade-off you accept before entering.
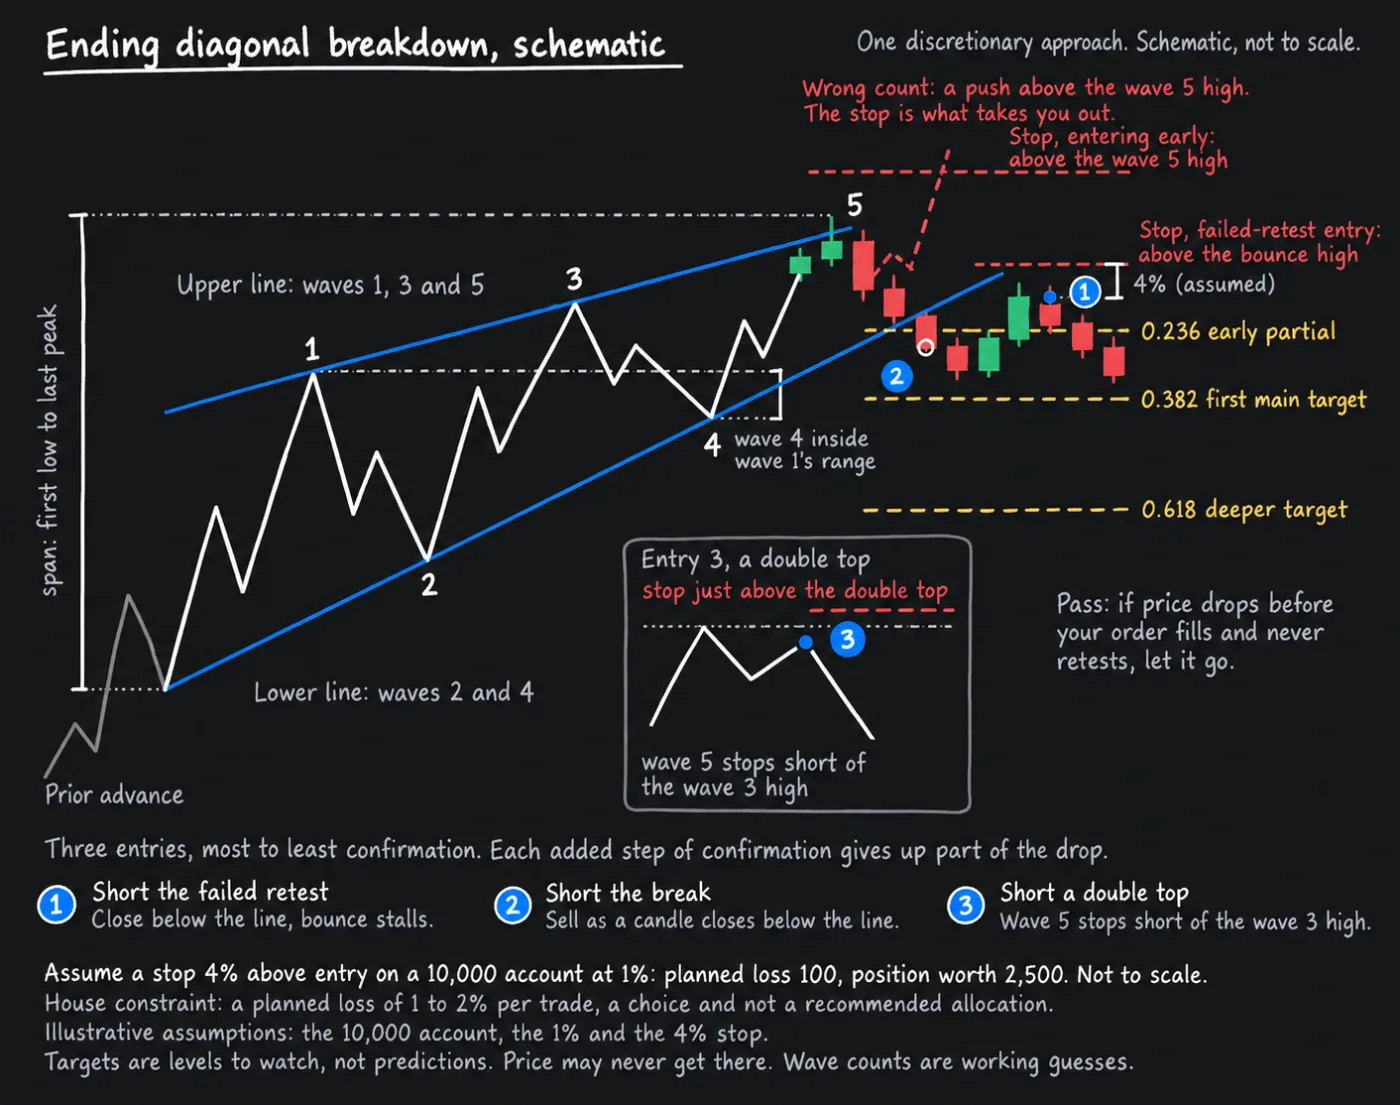
If price drops before your order fills and never retests, let it go. Chasing after the first leg of the drop leaves the stop far away and shrinks the reward to risk. Wait for the next bounce or pass. If price rises above the wave 5 high before your order fills, cancel it.
Execution assumptions
Assume a limit order that fills at its price, a cost allowance for fees and slippage as above, and a stop-market that fills at the next available price. If the entry does not fill, do not chase: the stop stays where it is and the reward shrinks.
Exits
Stop. Keep a real stop order above the wave 5 high or the bounce high, and move it only down, as below. Judge failure on a candle close rather than a wick, but use that to decide the idea is dead, not to pull the order.
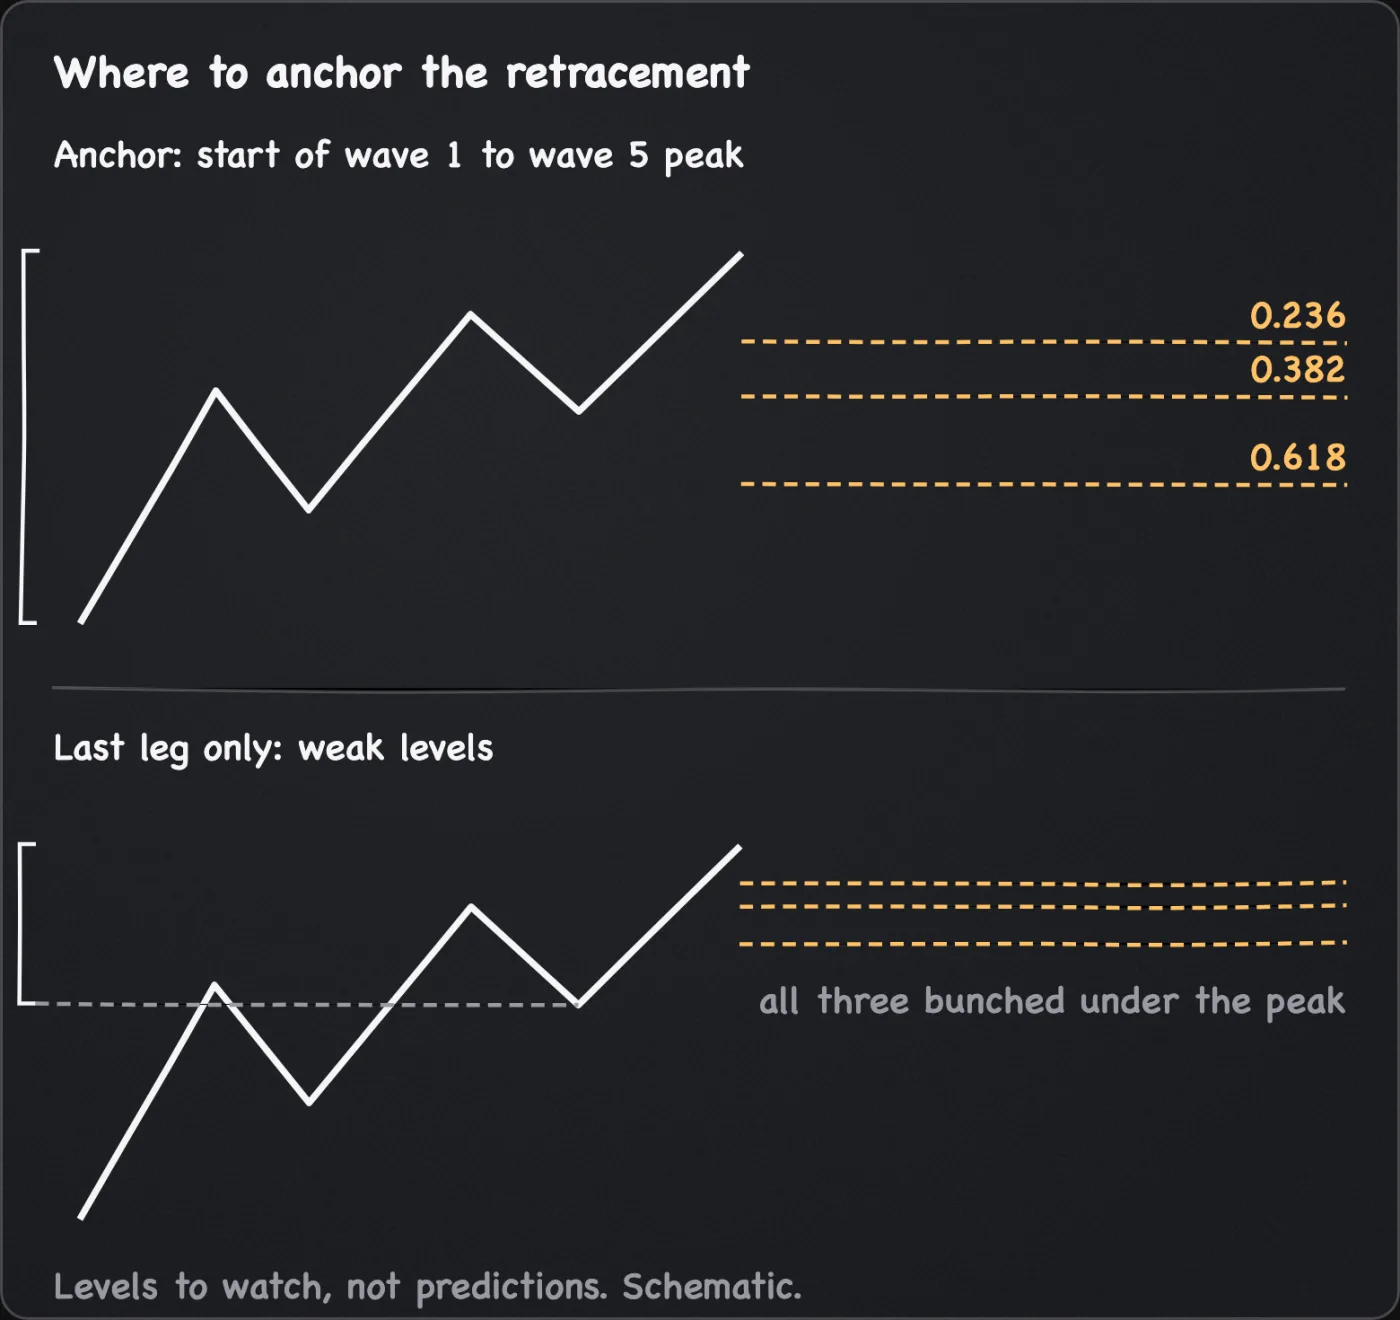
Taking profit. Anchor a Fibonacci retracement where wave 1 began and stretch it to the wave 5 peak, so it spans all five legs. Measuring only the last leg gives weak levels. Look for 0.236 as an early partial, 0.382 as the first main target and 0.618 as the deeper one, and give a level more weight when old support lines up with it. The 1.618 level of a trend-based Fibonacci extension marks a deeper level worth watching, not one to build the plan on. If you cannot watch the trade, take profit before the nearest support.
Moving the stop. Once the first target fills, move the stop down to your entry or just above the latest lower high. The Chandelier Exit trend ride can trail the rest once its line passes that moved stop in your favour, never before, and the stop never moves back up. Decide that before entry, and leave it off in a range or when you cannot watch each close.
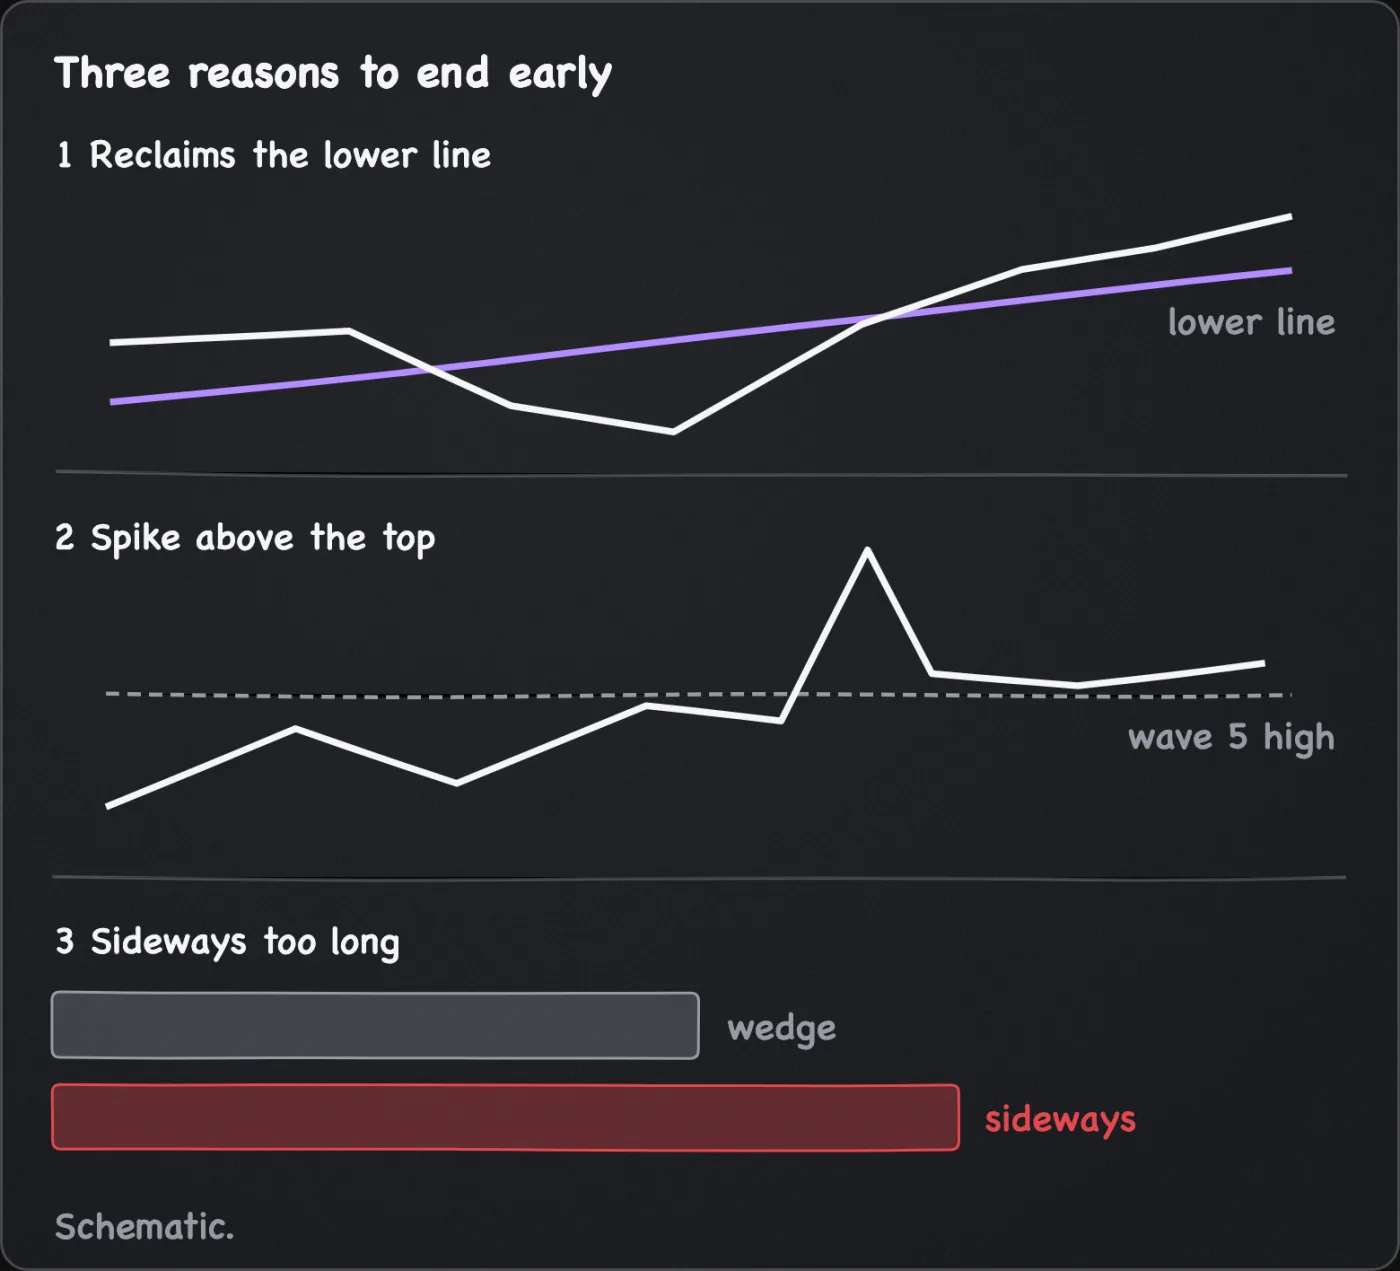
Ending early. Close the trade if price reclaims the lower line and holds above it, if a spike above the top makes another count more likely, or if price moves sideways for longer than the wedge took to form.
Common pitfalls
- Selling the first close below the line, then watching the bounce reach your stop. Wait for the retest to fail, or place the stop where a normal retest cannot reach it.
- Calling every rising wedge an ending diagonal. Check that it sits at the end of a move and that each leg splits into three swings.
- Confusing it with a leading diagonal. A wedge at the start of a move, in wave 1 or wave A, is read by the method as a start, with more trend in the wedge's direction after a pullback, so check where it sits in the trend.
- Forgetting the second count. A spike to a new high after the break can make the drop wave A of a correction, with a B wave that tops the wedge. The stop above the wave 5 high is what takes you out in that case.
- Adding to the short as price climbs. Size once, from the stop, and take the loss if the stop triggers.
- Trading it on a parabolic coin. Skip any coin in a vertical run; the stop would need to be so wide that the position becomes tiny.
What this cannot tell you
- Whether the count is right. A leading diagonal or a mid-trend wedge looks the same until it resolves, and this page cites no test of ending diagonals against chance.
- Whether this break holds. A close below the lower line can be followed by a bounce through the stop. The stop order sets the planned loss, not the realised one.
- How far price falls. The wedge's start and the Fibonacci levels are reference points, and a level can fail.
Questions
Is an ending diagonal the same as a rising wedge?
The shape is the same. The Elliott label adds two checks: the wedge sits in a wave 5 or wave C position, and each leg splits into three swings. A rising wedge in the middle of a trend fails both.
Which timeframe should I use?
Use the timeframe where the wedge is easy to see and the count is clean, usually one hour or higher. If a lower timeframe disagrees with a higher one, go with the higher one.