Definition
Riding a trend with the Chandelier Exit means holding a trade with no fixed target and letting a trailing line decide the exit. The first stop comes from chart structure and sets the size. Once the Chandelier Exit line moves past that stop in your favour, the line takes over. A stop only ever moves toward price, so the modelled loss at it never grows.
It is an exit-management method, not a setup: it opens nothing, and any setup can attach it to a trade it has already sized. Use it to decide, before entry, whether to hold past a fixed target, and where the stop sits at each stage.
How it works
The first stop sets the size, and the size stays
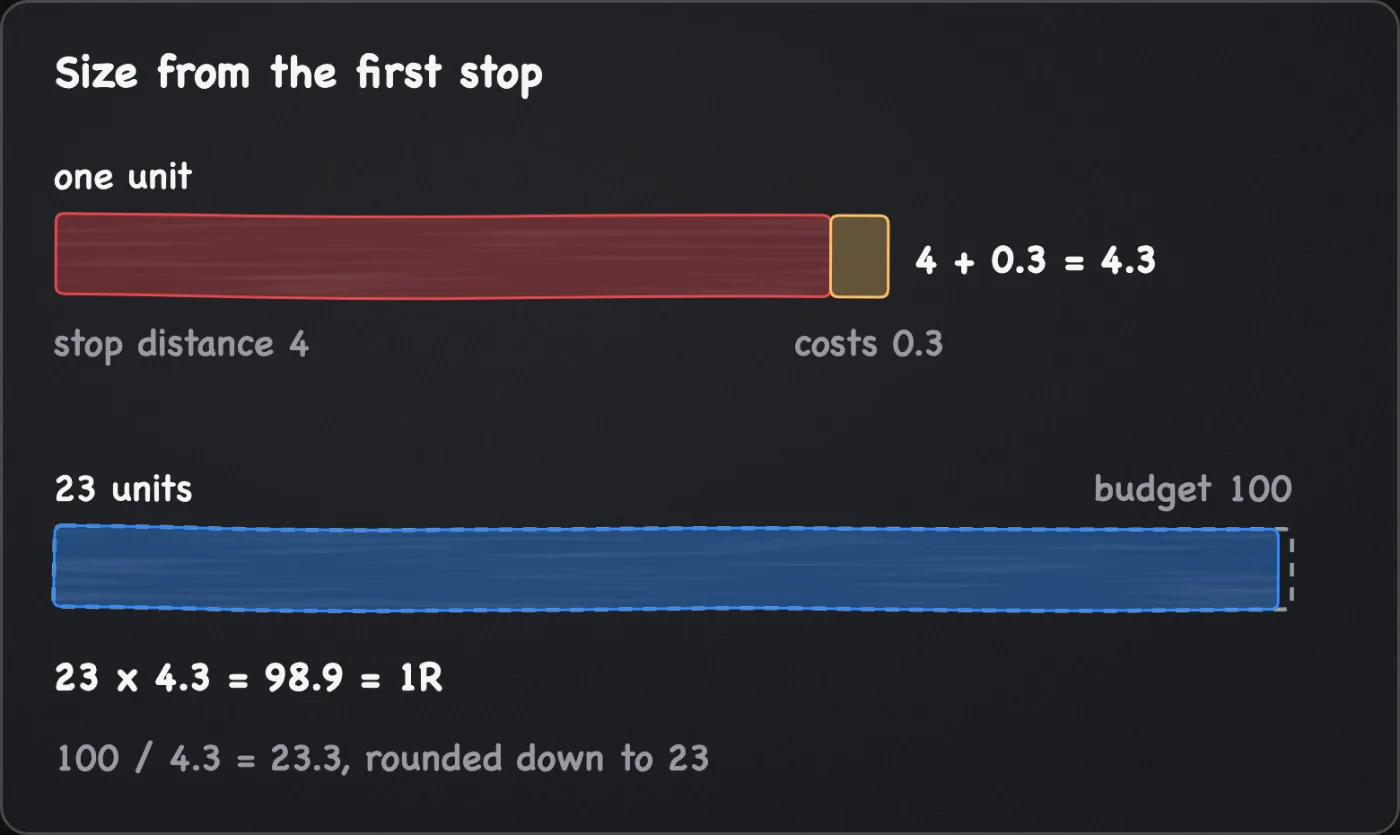
The trade starts with a first stop beyond the level where the idea is wrong, as stop-loss placement explains. The size comes from that stop: the planned loss in cash divided by the stop distance plus a cost allowance, as position sizing shows. This manual's house constraints are a planned loss of 1 to 2% of the account and a leverage ceiling of 3x. They are choices, not a recommended allocation, and lower is allowed. The trailing line never feeds back into the size, and R, the planned loss at the first stop with costs included, stays the unit for the whole trade. Fees, funding, slippage and gaps can still make the realised loss larger. A ride has no fixed end, so write a planned hold for the funding part of the cost allowance and the one-fifth cost check. A ride held longer pays funding beyond it, and the realised R moves.
The handover
A long has two candidate stops: the first stop, and the line. The line is the highest high of the last N bars minus ATR(N) times the multiplier, kept from falling while price stays above it (the ATR page covers the inputs).
- Until the line moves past the first stop in your favour, the first stop stays.
- After that, the line is the exit, and the backstop order is moved behind it.
- The stop never moves back. If a chart script plots a line that dips, leave the order where it is.
A short mirrors this, with the line falling and the stop order lowered.
For arithmetic only, assume a long at 100 on a 10,000 account with a first stop at 96, and a planned loss of 100, which is 1%. Assume costs of 0.3 per unit across both fills, so the size is 100 / 4.3, about 23.3, rounded down to 23 units. The planned loss with costs is 23 x 4.3 = 98.9, which is 1R. Assume Chandelier Exit (22, 3.0) with ATR(22) at 3, so the line sits 9 below the highest high, and a highest high of 100 at entry.
| Highest high | Line | Active stop | Net result if the stop fills there | R |
|---|---|---|---|---|
| 100 | 91 | 96, the first stop | -98.9 | -1.00 |
| 105 | 96 | 96, the line has not passed it | -98.9 | -1.00 |
| 108 | 99 | 99, the handover | -29.9 | -0.30 |
| 112 | 103 | 103 | +62.1 | +0.63 |
| 115 | 106 | 106 | +131.1 | +1.33 |
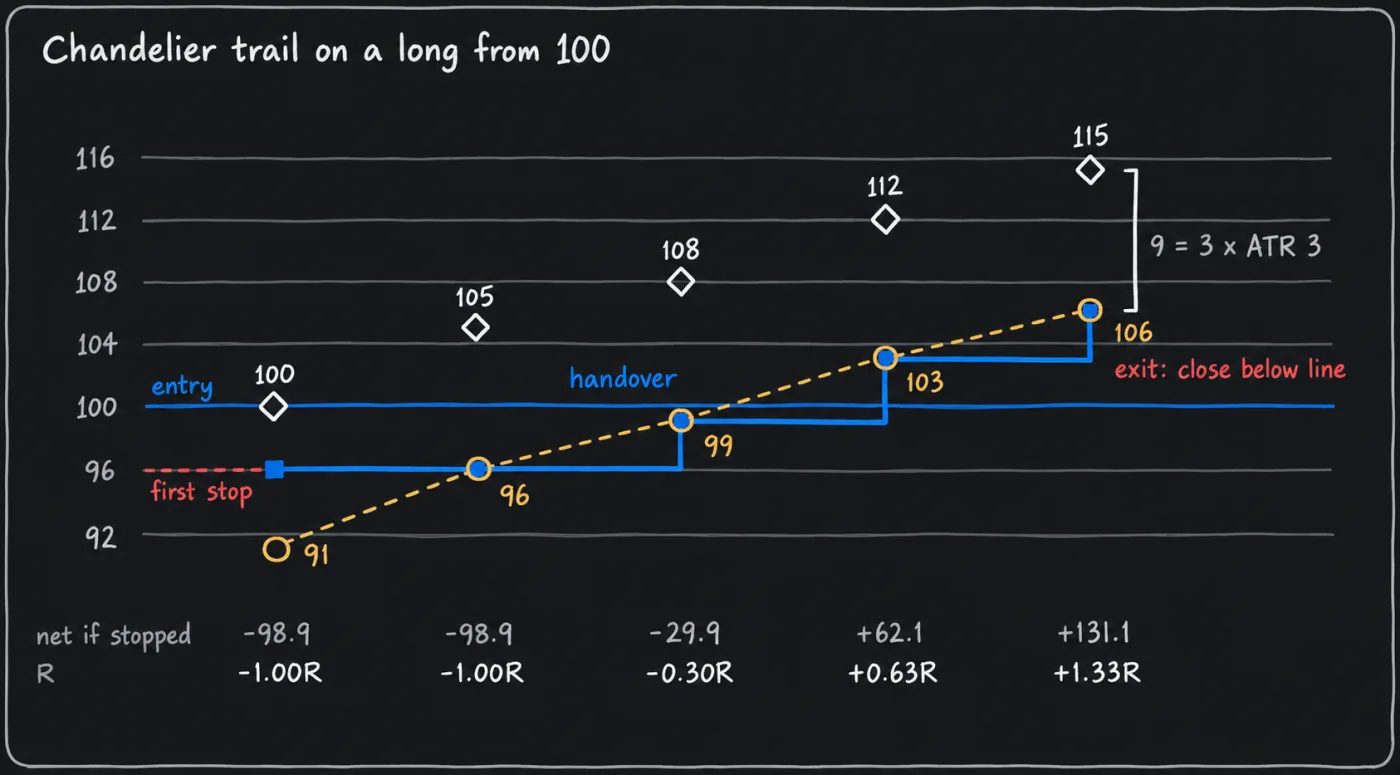
Each result is 23 x (stop - 100 - 0.3), and R is that divided by 98.9. The line cannot pass 96 until the high exceeds 105, the first stop plus the 9. The rows are a ladder of stop positions, not a forecast that price climbs. If ATR then rose to 4, the plain line would be 115 - 12 = 103, but the stop stays at 106, so the distance below the high is not fixed.
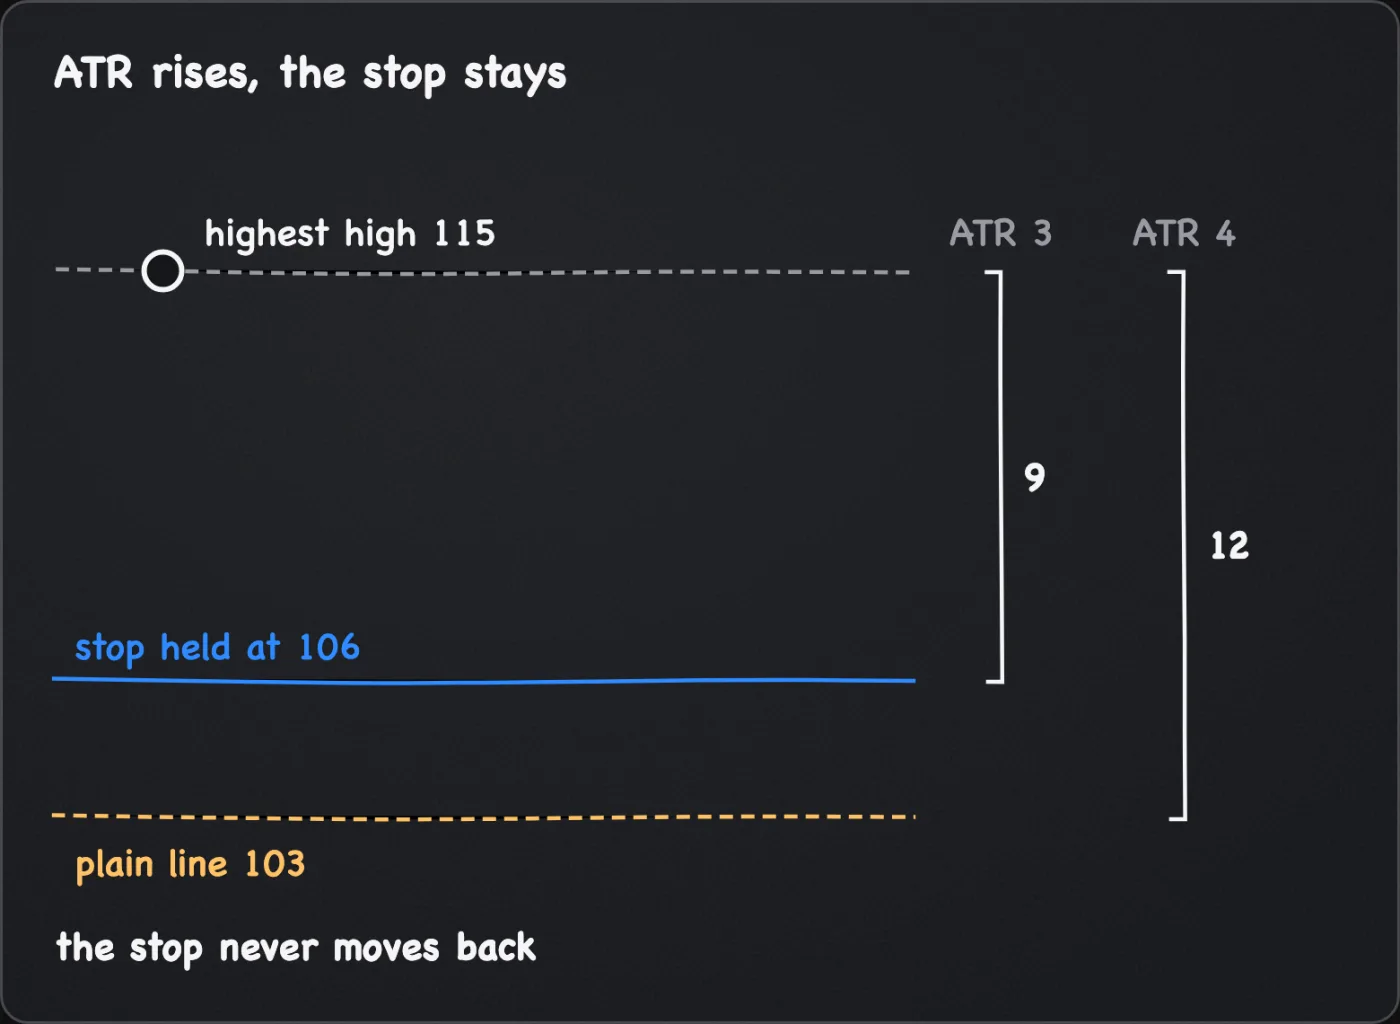
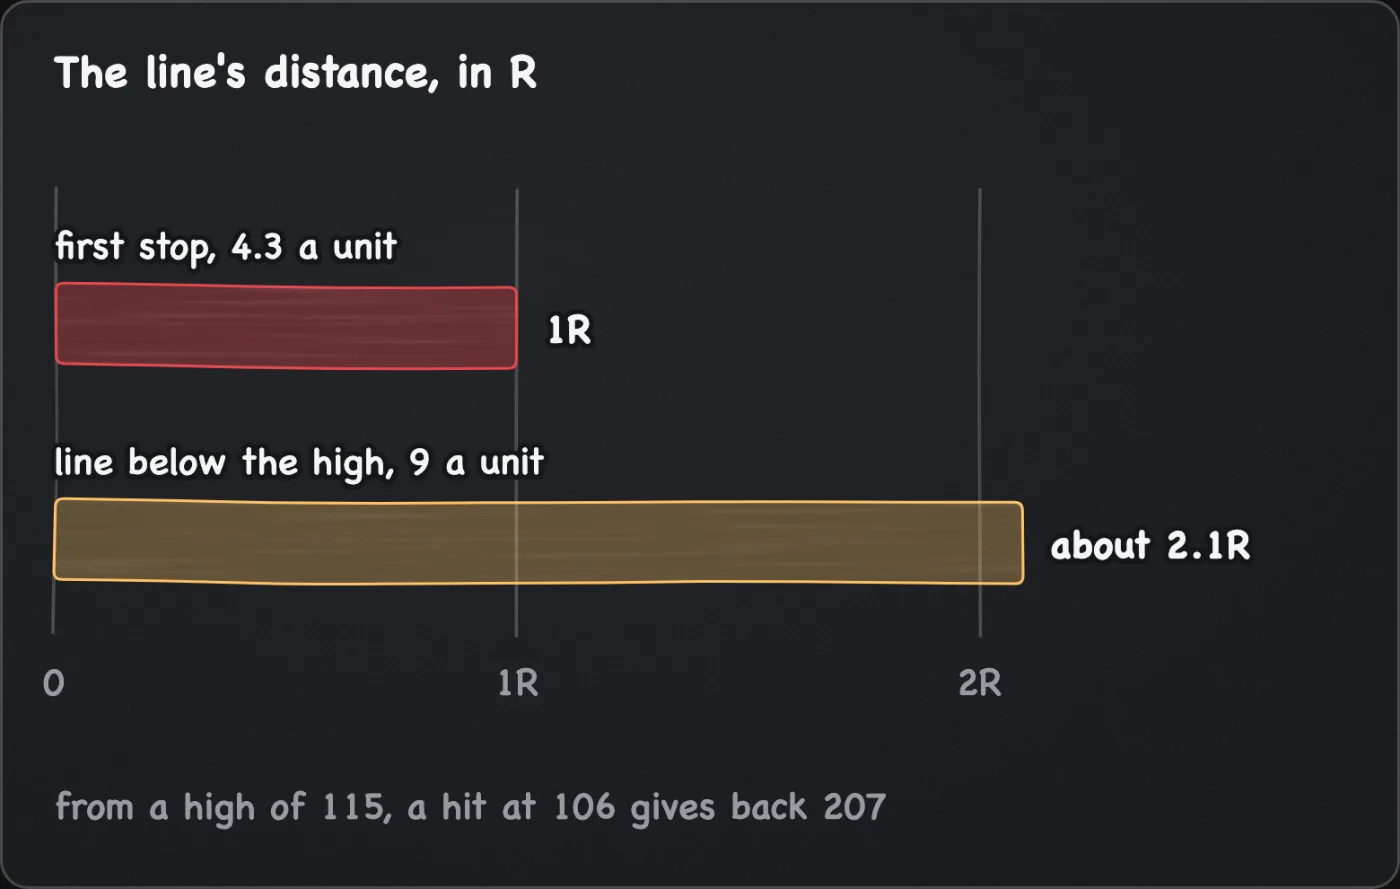
R stays measured against 98.9, not against the line's distance. And the trail sits about the line's distance below the lookback high: from a high of 115, a hit at 106 is 9 per unit, 207 for 23 units, about 2.1R of open gain returned. At the same high and ATR, a wider multiplier sits farther below it, and a tighter one is hit more often.
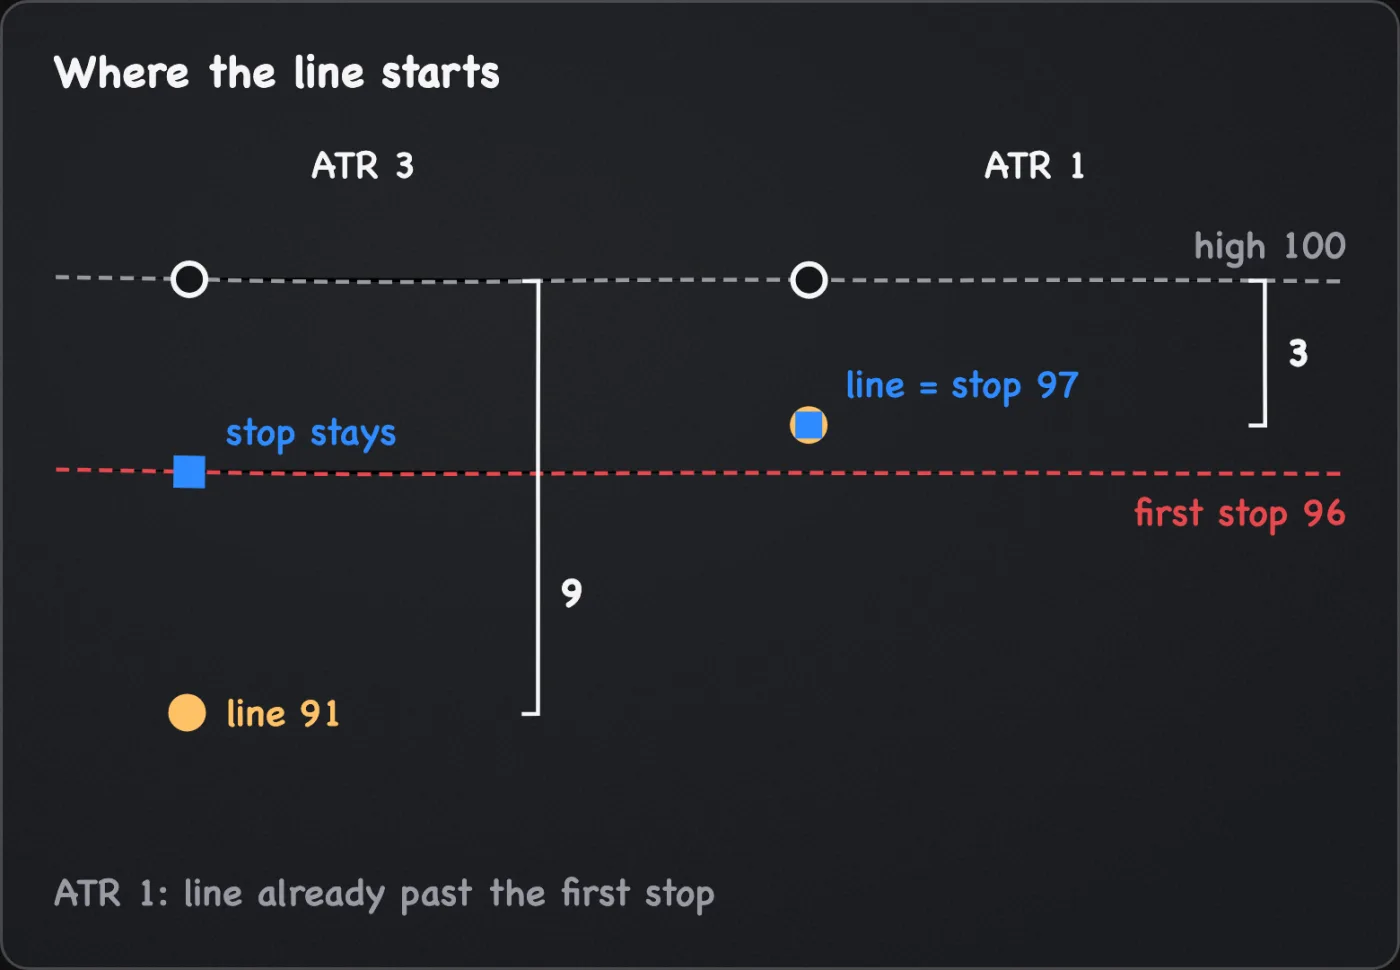
If ATR(22) were 1, the line would sit 3 below the high, and at entry it would be 97, already past the first stop. The rule then puts the stop on the line from the first order. That can only shrink the modelled loss, but a close beyond the line can end the trade before the idea is wrong. If you do not want that, leave the ride off for this trade.
The order
The default follows the Chandelier Exit page: the exit is a candle close beyond the line on your chosen timeframe, taken by hand with a reduce-only market order. A reduce-only stop-market stays on the exchange as the backstop for a fast move. It starts at the first stop. After each close it is moved toward price to the line's value less the stop buffer the plan names for a long, or plus it for a short (the examples assume 0.5 x ATR(14), as for the first stop): up for a long, down for a short, and never moved back. If price reaches the order before a close, the order decides. When a higher-timeframe wick crosses the line, the lower-timeframe check on that page is the one reason to leave before the close. The default needs you at the screen at each close.
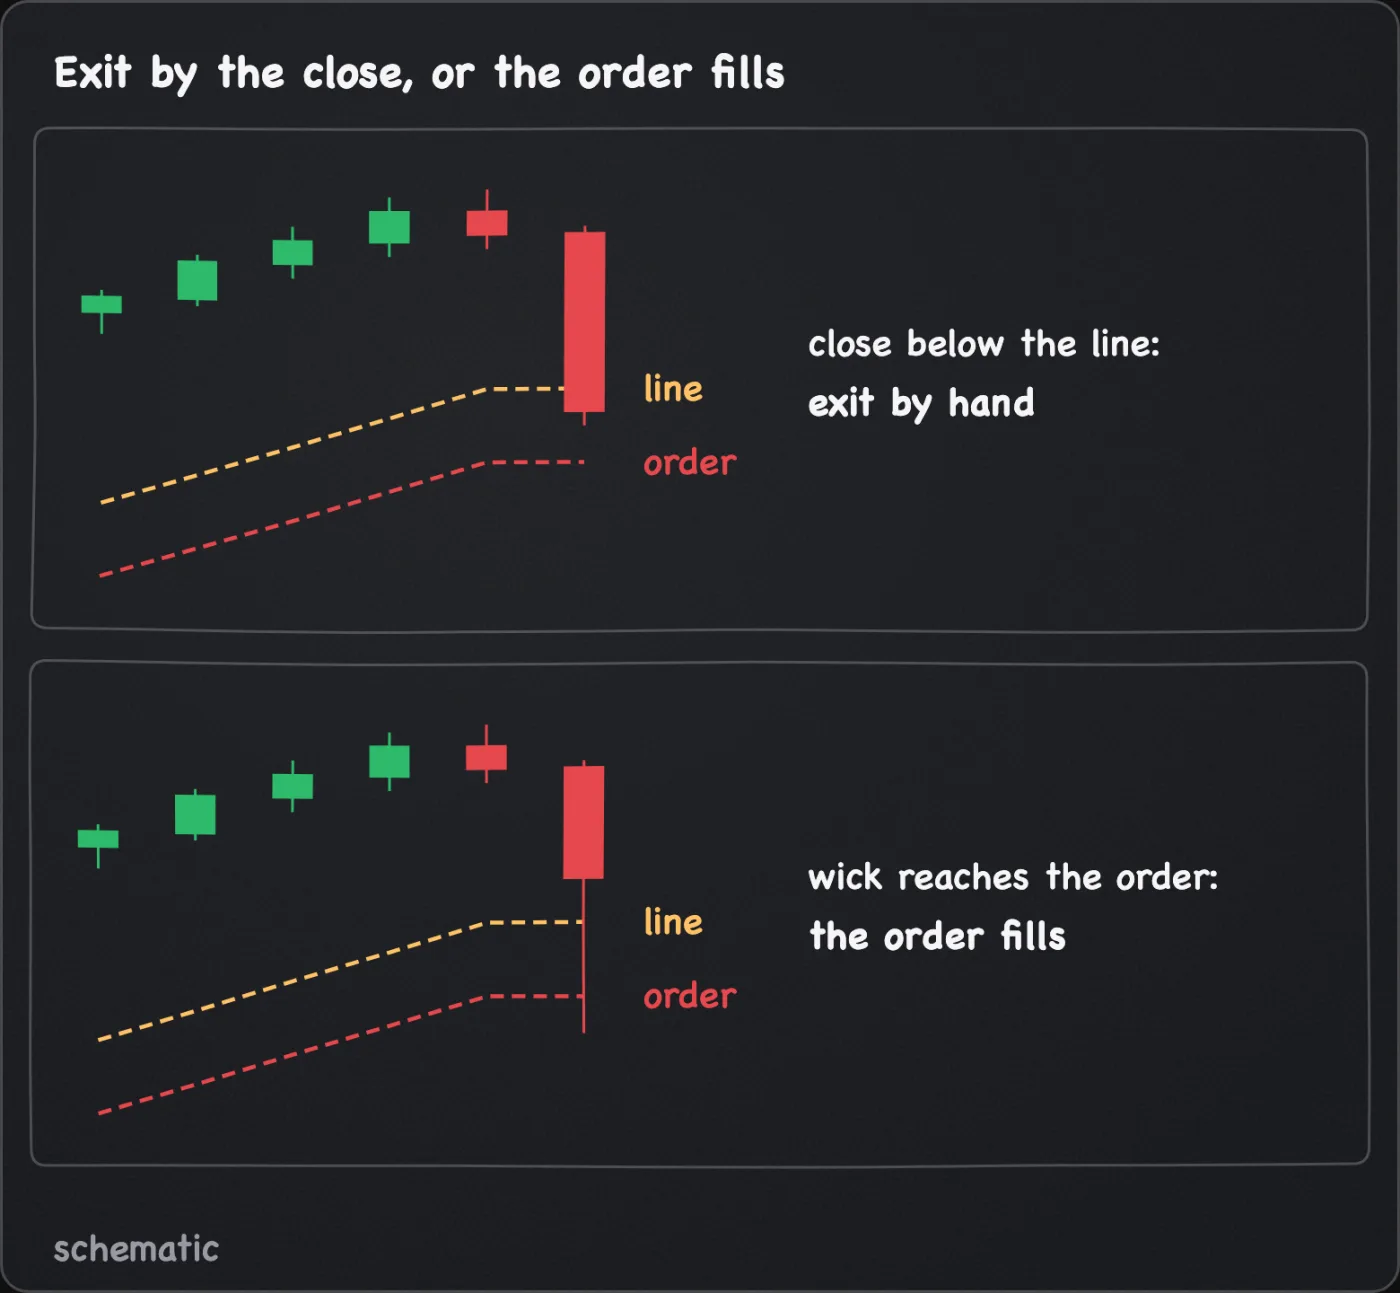
The variation is a resting exit: after each close, move the order's trigger to the line's value on that candle. It needs no one at the screen, but the order triggers on price, so a wick can end the trade before any candle closes, which the Chandelier Exit page lists as a mistake under its default. Fix one version in the plan before entry. This page cites no test of either.
A trailing-stop order on an order form commonly trails by a fixed percentage or amount, which is not this line. After a partial exit, resize the stop to the quantity left (order types covers reduce-only).
Default settings
The line's settings are the published ones. The rest of the table lists this manual's reference values for the ride, since no published default covers it.
| Item | Value | Status and limitation |
|---|---|---|
| Line | Chandelier Exit (22, 3.0) | Published default. Variations: a shorter period of 14, or a wider multiplier of 3.5 to 4.0 for small coins and charts below the 1-hour, which sits farther from the high. |
| First stop | Structure level plus a buffer; the examples assume 0.5 x ATR(14) | This manual's choice, not a tested value. |
| Handover | When the line moves past the first stop in your favour; the stop moves toward price only | This manual's choice. The line can already be past the stop at entry. |
| Exit | A candle close beyond the line on your chosen timeframe, closed by hand; a reduce-only stop-market backstop a buffer beyond the line, moved toward price after each close, up for a long and down for a short, and never moved back | This manual's choice, following the Chandelier Exit page. Needs you at the screen at each close. Variation: trigger moved to the last closed line value, so a wick can end the trade. |
| Variation: shorter timeframe | A lower-timeframe line in a parabolic run | Described on the Chandelier Exit page. The tighter line flips far more often. |
How it is used in this manual's setups
- Ending diagonal breakdown. After the first target fills, the line is one optional way to trail the rest of the short.
- Breakout continuation long. A trend-following entry, so this is the exit it is paired with.
A partial exit first, then the line on what is left, is the combination taking profit covers. The volatility scanner shows how strongly a coin is moving now, which helps you check whether ATR has caught up with a recent surge. The manual route is ATR as a share of price on the chart you trade.
When to switch it on
Switch it on in the plan, before entry, when all of these hold.
- The plan has no fixed target, or part is closed and the rest is meant to run. The decision cycle asks for a trailing rule to be written before the order.
- The settings and timeframe, including any switch to a lower-timeframe line in a parabolic run, are written in the plan now, not after the trade moves.
- You have written the line's distance in R (9 / 4.3, about 2.1 in the example) and accept that return from a peak. If not, choose a target.
- The liquidation price on the ticket sits well beyond the first stop. Fees and funding can move it closer over a long hold, so read the ticket again as the trade runs.
When to leave it off
- Ranges. In a sideways market the line flips on every swing and the trade ends early.
- A line wider than the plan accepts. On a volatile coin it can sit 8% or more from price. Take a target instead.
- A plan with one target at a real level, or a trade you cannot watch at each close on your timeframe. The target is the exit, and the order needs raising after each close.
Common mistakes
- Choosing the first stop or the size from the line. It knows nothing about where the idea is wrong. Set both from structure. The line replaces the stop only when it is already past it in your favour.
- Changing the multiplier mid-trade to protect open gain. A changed setting is no longer the plan you wrote, and a tighter line is hit more often.
- Letting the stop move away, or leaving the old quantity on it after a partial exit. A plotted line can dip when ATR expands. Keep the order where it is, and resize it, reduce-only, to what is open.
- Adding size because the stop now sits in profit. An add is a new plan with its own stop and size, and it counts against the group cap and the 4% total in portfolio risk.
What this cannot tell you
- That the trend continues. The line trails price and says nothing about where it goes. A trade can reverse right after the handover and return most of its gain.
- That trailing beats a fixed target. This page cites no test of either on perpetuals. A trail sits below each lookback high by about its distance and a target caps the gain, so which pays more depends on how often price runs and how far.
- The exit price. A stop-market fills at the next available price, so a gap or a thin book can make the realised loss or the give-back larger than the arithmetic here.
- Whether to exit on a wick or a close. The line marks a distance. It cannot say which trigger suits the coin.
- Whether a setting suits the next trend. A multiplier chosen after the last move is fitted to it.
Questions
How do I ride a trend with the Chandelier Exit?
Size from the first stop, keep it until the line moves past it in your favour, then exit on a candle close beyond the line, with a reduce-only stop order a buffer beyond the line as the backstop, moved toward price after each close, up for a long and down for a short, and never moved back.
Is a trailing stop better than a take-profit target?
Neither is better in general. A target fixes the gain and may leave a run unused. A trail leaves the gain open and sits about its distance below the high. Whether either pays more is a testing question.