What it is and when it applies
This page helps you decide whether to short a broken rising trendline when price comes back to test it from below, or to pass. A rising line through swing lows breaks on a close beneath it. Price then rallies toward the line and stalls under it. The short is the stall, with the stop above the retest candle's high.
The idea is that a broken support line can act as resistance. The mechanism offered is that traders who bought near the line are underwater and may sell near break-even when price returns. That is a plausible mechanism and a belief, not a promise: price can run through the line without a pause, and a stalled retest can still be followed by a new high. This page cites no test of how often a retest of a broken line holds. The lower edge of a rising channel works the same way.
It fits a trend that respected one line for some time and then closed beneath it. It does not fit a sideways market, a line that cuts through many candle bodies, or a line drawn after the break. Trendlines and channels covers drawing one. Whether a chart has a valid line is your call, and two careful traders can draw different ones.
Before you enter
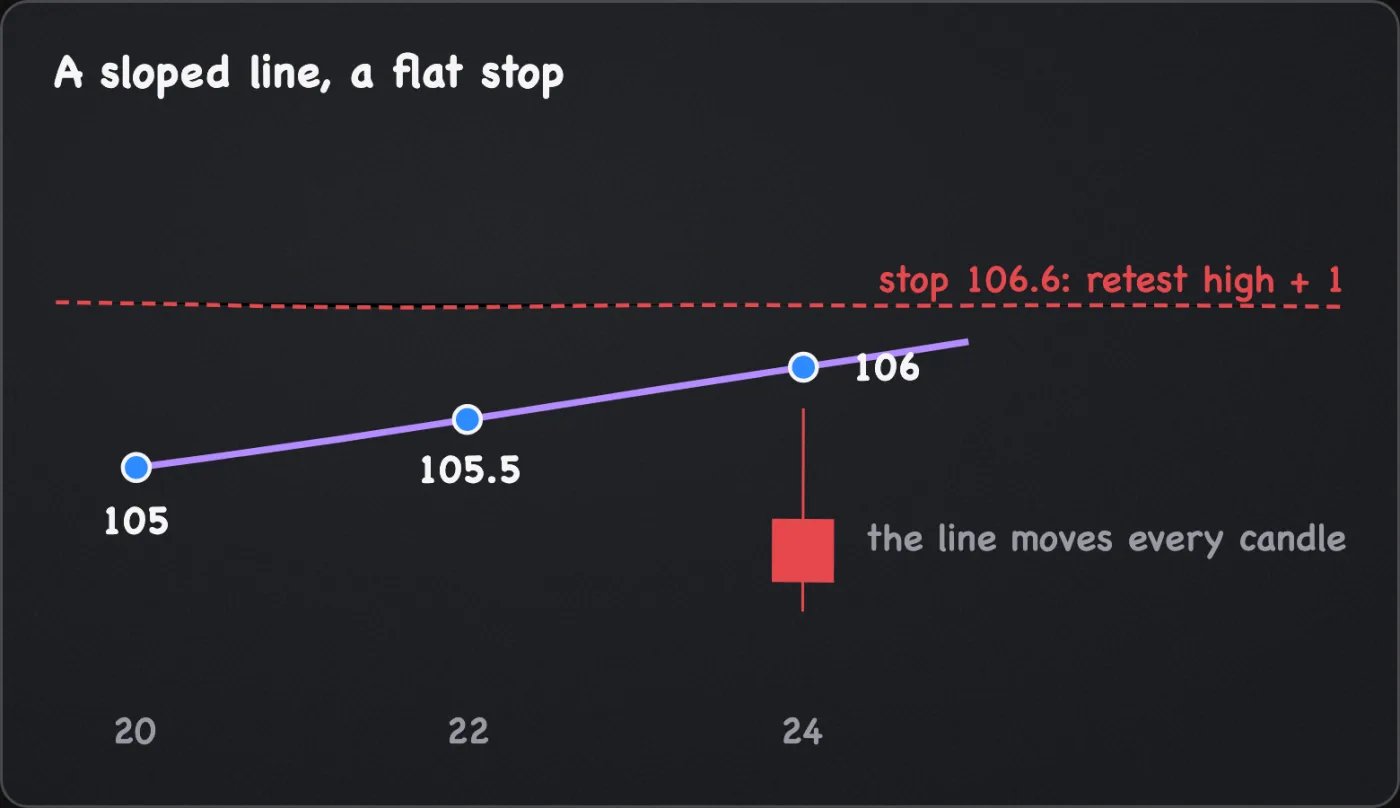
The short is wrong if a candle closes above the retest candle's high. The retest then failed to turn price. The stop order goes just beyond that high. The line defines the break and the retest and stays out of the exit, because a sloped line moves every candle and a standing order does not. The examples assume a buffer of 0.5 x ATR(14), an assumed example and not a rule. A wider buffer takes a bigger move to reach and shrinks the position, and a tighter one does the reverse. Stop-loss placement explains the level, the close and the order.
This manual's house constraints are a planned loss of 1-2% of the account per trade and a 3x maximum leverage. They are choices, not a recommended allocation, and less, or no position, is always allowed. Sizing inputs:
- Account risk: the planned loss in cash, 1-2% of equity or lower.
- Entry price: the assumed fill, near the retest candle's close.
- Stop price: the retest high plus the buffer.
- Cost allowance: a per-unit amount for fees and slippage, added to the stop distance, plus funding for the planned hold. The examples assume 0.3 per unit, an illustrative figure (trading costs and liquidity covers it).
- Leverage cap: the leverage setting, and all open position values plus this one over account equity, 3 or less.
- Liquidation distance: the ticket's estimated liquidation price, above the stop for a short. If the gap is not wide, lower the leverage setting.
Units = planned loss / (stop minus entry, plus allowance), rounded down (position sizing has the sum). Units x (distance + allowance) is the planned loss if the stop fills at its price. A gap, slippage or funding can make the realised loss larger.
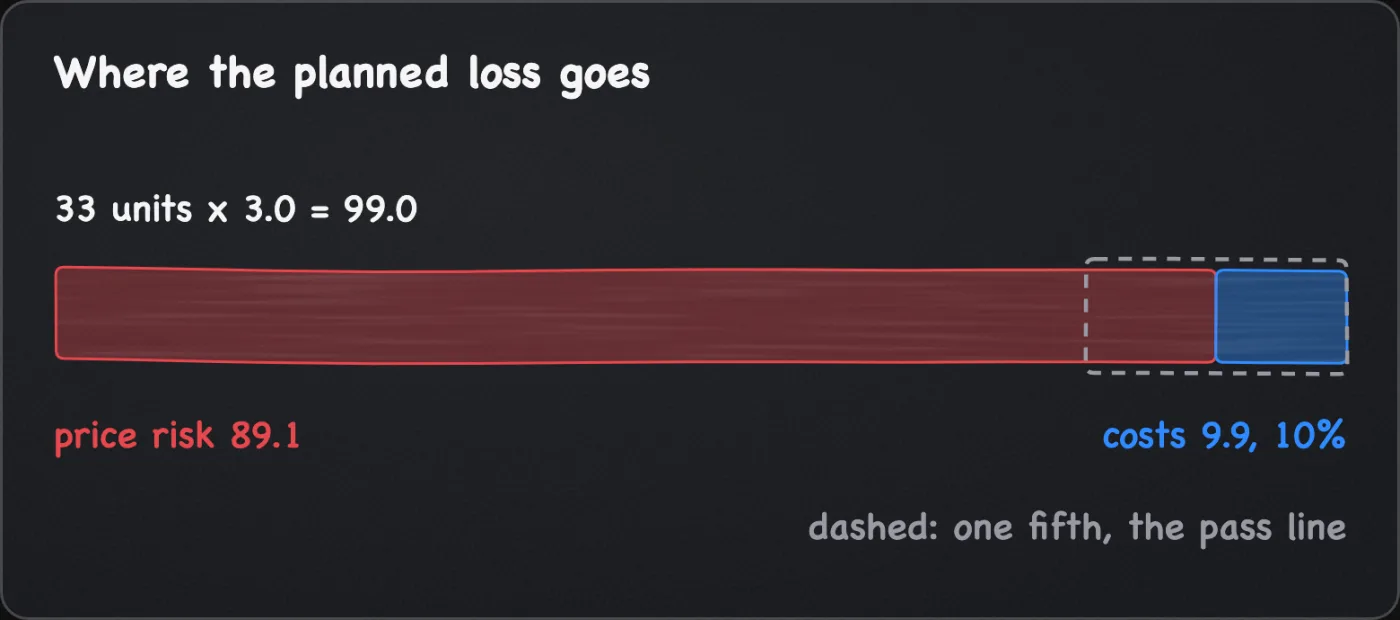
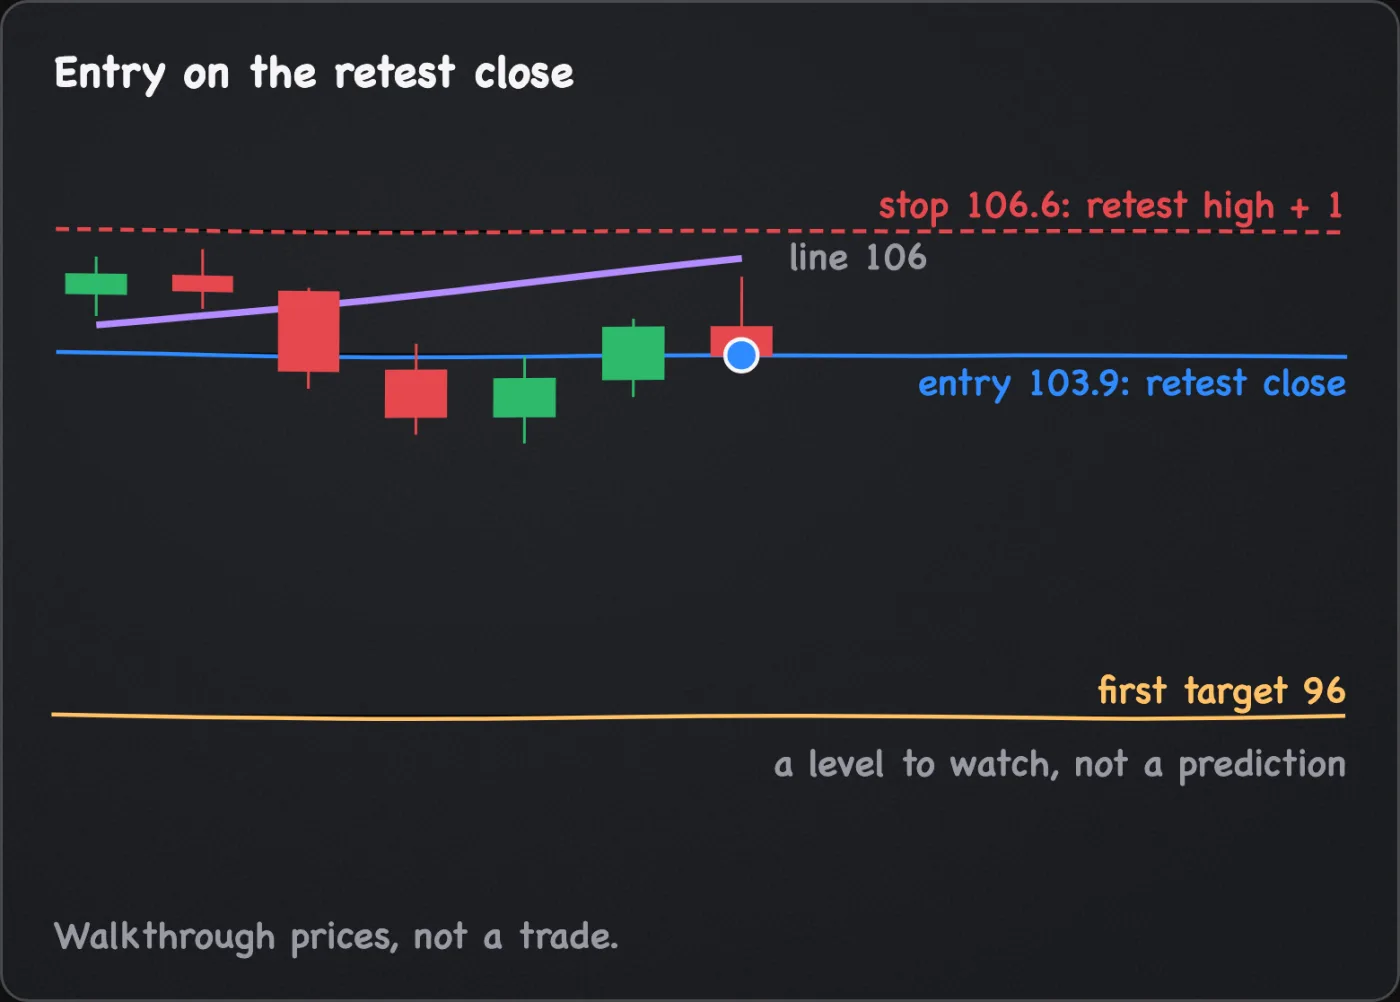
For arithmetic only, assume a 10,000 account and a planned loss of 1%, or 100. Assume a rising line through 100 at candle 0 and 102 at candle 8, a slope of 0.25 a candle, so it sits at 105 at candle 20 and 106 at candle 24. Candle 20 closes at 103.6 and ATR(14) is 2. Candle 24 trades up to 105.6, 0.4 under the line, and closes at 103.9. The stop is 105.6 + 1 = 106.6. Entry at 103.9 is 2.7 away, 3.0 with the allowance. The size is 100 / 3.0, about 33.3, so 33 units, worth 3,429, or 0.34 of the account. The planned loss with costs is 33 x 3.0 = 99.0, and costs are 10% of it, because a close stop leaves little room for them.
Conditions
Each of these must be checkable on the chart.
- The line has three or more touches, a common convention. The anchor points, with dates, are written down before the break. Touches and the break are measured the same way, through bodies or through wicks, on a scale you noted.
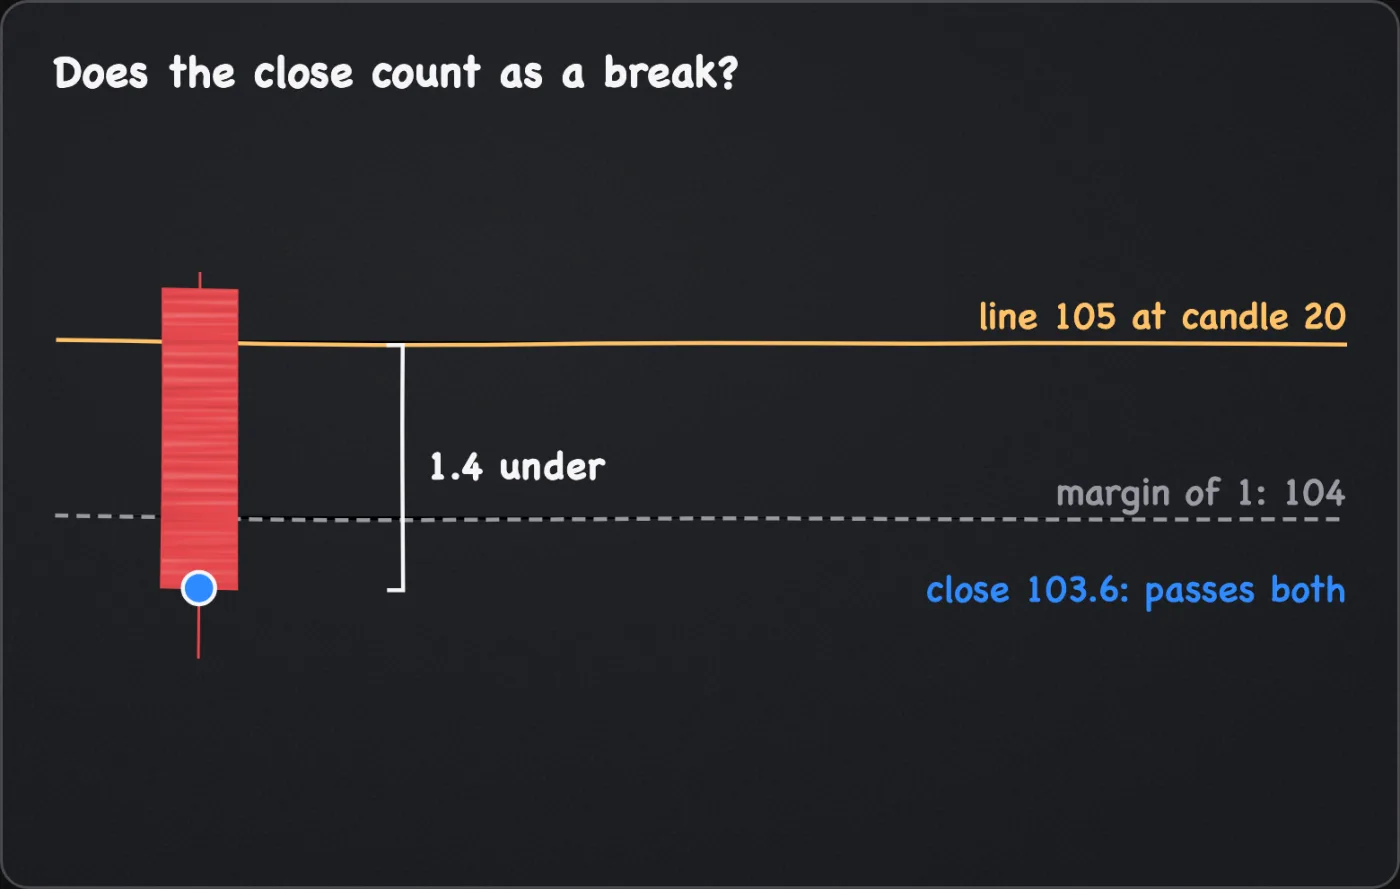
- A candle closes beyond the line by a rule you fixed. The plain close is the usual convention. A margin, such as 0.5 x ATR(14) as an assumed example, or two closes in a row are variations that reject more breaks and enter later. In the example, 103.6 is 1.4 under the line at 105, so it passes the plain close and a margin of 1.
- No candle has closed above the line since the break.
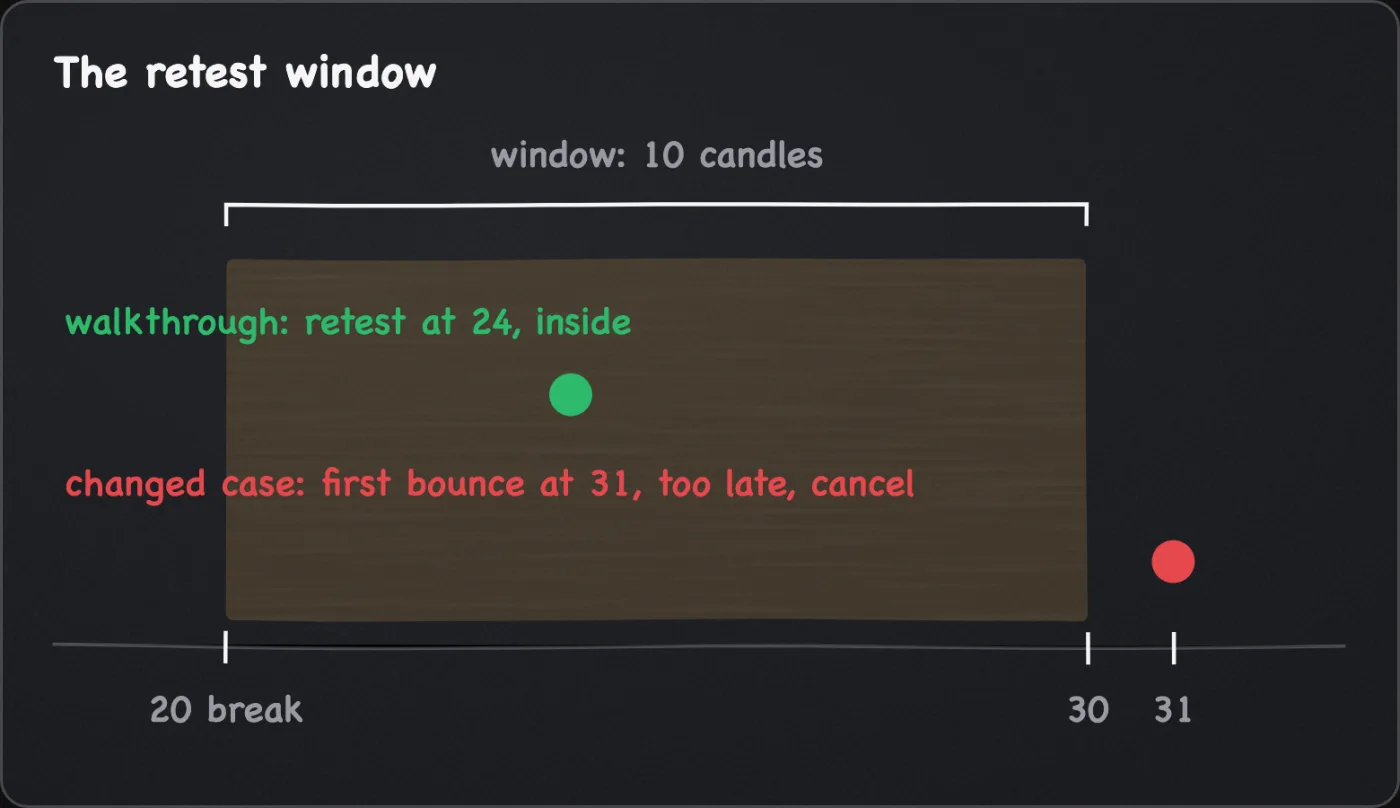
- Inside a window you fixed (assume 10 candles after the break), a candle trades up to within a distance you fixed of the line (assume 0.5 x ATR(14)), or through it, and closes below the line. That is the retest candle.
- There is room: the reward to the next support, after costs, passes a test you wrote before the trade. This manual sets no minimum ratio. Risk to reward gives the break-even share to compare against.
The volatility scanner lists coins by recent movement. The manual route is ATR as a share of price on the chart you trade.
Reasons to pass
Passing is a valid result. Pass when:
- the line has fewer touches than your rule, cuts through many candles, or was drawn or moved after the break
- no retest arrives inside the window
- a candle closes above the line, so the break is undone
- the size the stop allows is below the exchange minimum
- costs come to more than one fifth of the planned loss, which a close stop makes easy to reach
- the reward to the next support fails your written test
- the book near the line is thin enough that your own order would move it, or the context chart has closed back above the line
Entry
Entry on the retest close
The trigger is the close of the retest candle. Place a limit order at or just above that close, or a market order if getting in matters more than the fill price. The stop is a reduce-only stop-market buy above the retest high plus the buffer. A stop-limit with its limit above the trigger caps the fill price but can sit unfilled in a gap (order types explains).
Entry on a confirming close
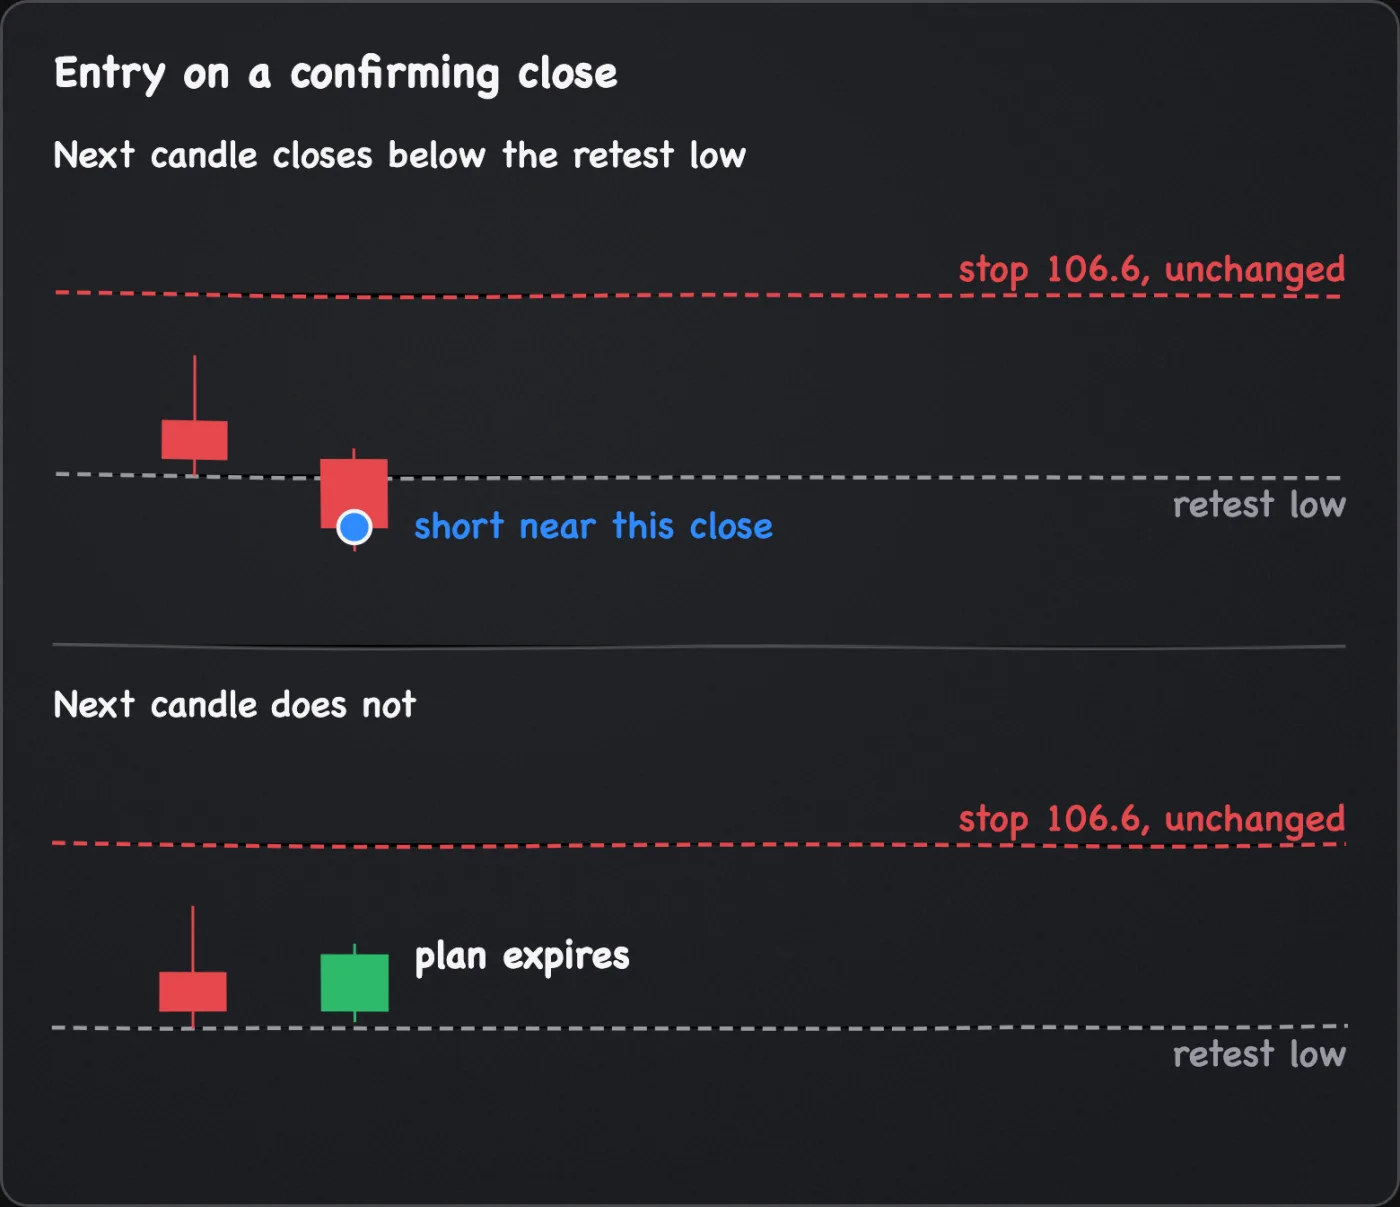
Wait one candle. If it closes below the retest candle's low, short near that close. If it does not, the plan expires. The stop stays above the retest high, so the entry is lower, the distance longer and the position smaller. It skips retests that stall for one candle and carry on up, and gives up some of the move. Choose one trigger before the retest.
Execution assumptions
Assume the limit fills at its price, 0.3 per unit covers fees and slippage, and the stop-market fills at the next available price. If price falls away without a retest, the entry is gone, and chasing it stretches the stop and shrinks the size. If the window ends, cancel. Breakouts and retests explains why a late retest is a different trade.
Hypothetical walkthrough
Hypothetical walkthrough. Invented prices and an invented outcome, chosen to teach the decision. Not a recorded trade, and not evidence of how often this setup works.
The reader writes the plan before the retest: if a 4-hour candle closes beneath the line, then within 10 candles one trades to within 1 of the line and closes under it, short near that close with the stop 1 above that candle's high, sized from the distance. At the retest close that gives an entry near 103.9, a stop at 106.6 and 33 units, a planned loss with costs of 99.0. With the prior support at 96 as the target, the reward after costs is 7.6 against 3.0, about 1:2.5 if every unit closes there.
Now change one fact. The first bounce reaches the line on candle 31, 11 candles after the break. The window has closed, so the plan is cancelled. No position is open, and the log records a pass with its reason. The outcome was chosen to show an expiry window doing its job, since the same bounce taken late is a trade nobody planned.
Exits
Stop. Keep the reduce-only stop above the retest high plus the buffer. A decision-timeframe close above the retest high means the idea is wrong: close by hand, then cancel the order once you are flat. The order stays as the backstop while that close is pending or you are away.
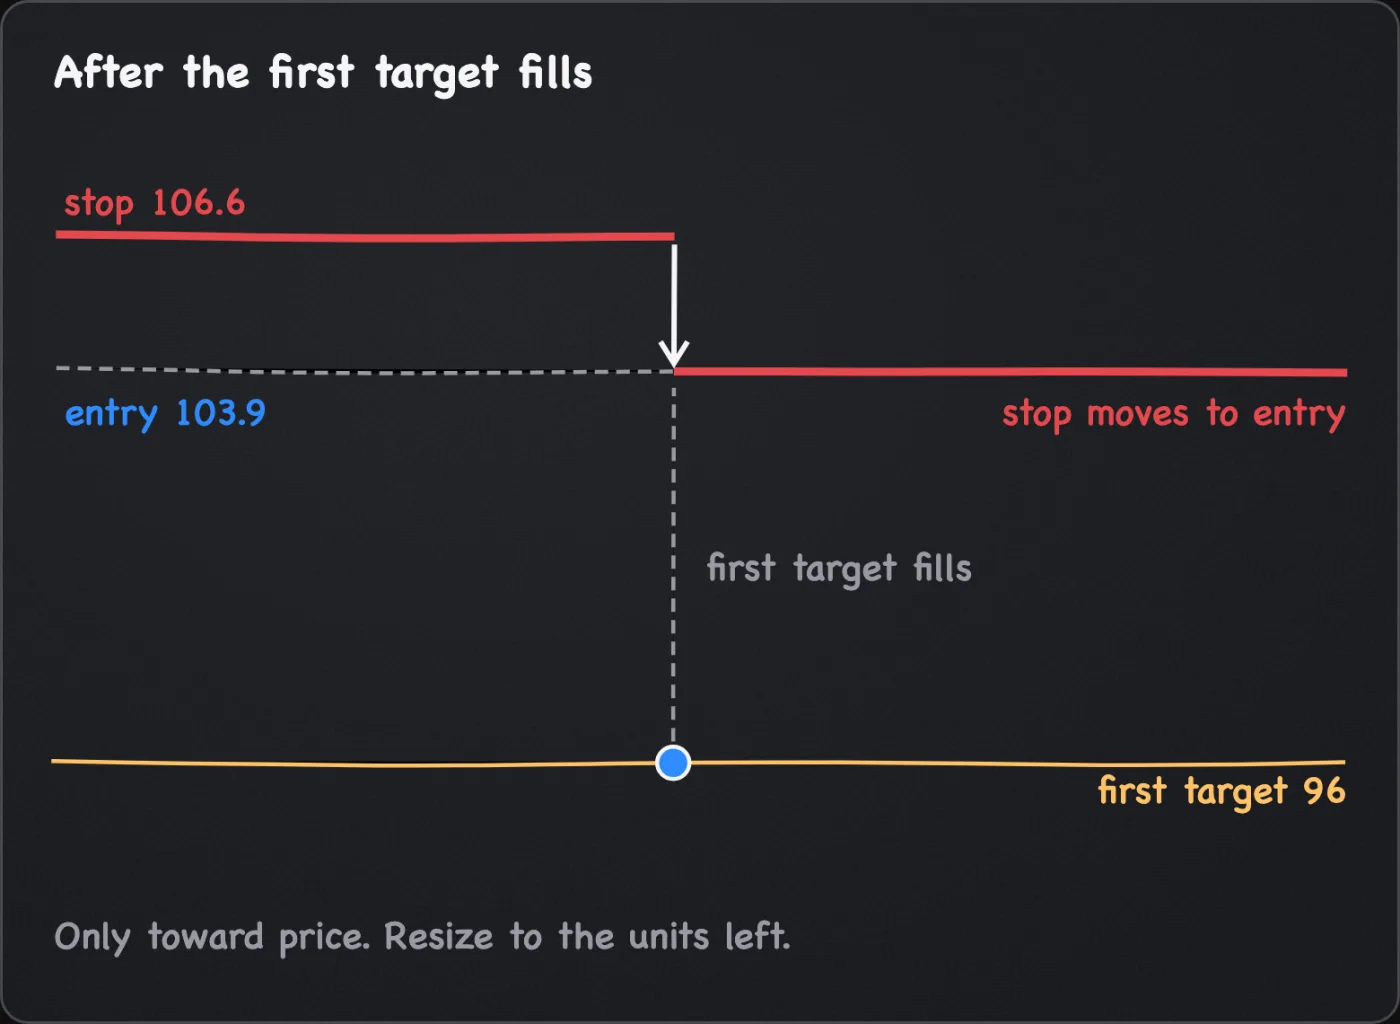
Taking profit. The first target is the prior swing low or the next support band, marked before entry. Close part there and write the rest of the plan before the order (taking profit covers partial exits and the R arithmetic). After a partial, resize the stop to the units left.
Moving the stop. After the first target fills, move the stop to entry or just above the latest lower high. It only moves toward price.
Ending early. Write any earlier exit before entry, for example closing if price has not reached the first target within a number of candles you fixed. A short retaken after a bounce is a new plan with its own stop and size.
Common pitfalls
- Shorting because price touches support. The trigger is a close beneath the line and a retest that closes under it, not a touch.
- Redrawing the line after the break. A line moved after each cut can never say the idea is wrong. Keep the dated anchors.
- Waiting for a retest with no end date. Set a window and cancel when it closes.
- Putting the stop at the line. The retest can trade through the line. The order belongs above the retest high.
- Adding on a second rejection without a plan. An add is a new trade with its own stop and size.
What this cannot tell you
- Whether the break is a change of trend or a pause. A close beneath the line says your rule was met. Price can reclaim the line.
- Whether the retest is over. One stalled candle can be followed by a push through the line.
- Which line is right. Bodies or wicks, log or linear and the choice of swings can differ between careful traders, and nothing on the chart settles it.
- How far price falls, or where the stop fills. The support level is a reference, and a fast market can fill the stop past its trigger.
Questions
Do I need a retest to short a trendline break?
No, but this page covers only the retest entry. Shorting the break close is a different trigger with a different stop, and price may never come back.
Does a broken trendline always become resistance?
No. It can, and the usual explanation is traders selling near break-even. Price can also pass through without pausing, which is why the trigger is a retest that closes back under the line and not the break alone.