Definition
To take profit in crypto trading, write the exit before you enter: a target at a real level, a share of the position to close there, and a rule for the rest, either a stop or a trail. Each part leaves by a rule written in advance.
Three tools do the work. A target is a price where the position, or a share of it, closes. A partial exit closes only a share and leaves the rest open. A trailing stop closes what is left when price pulls back by a set distance. Each trades the certainty of banking a gain against room for it to grow. Use this page to decide where each part of a position exits, before the entry order goes in.
How it works
Targets come from the chart
A target is a price at the next real level in the trade's direction, as risk to reward explains. It is usually a limit order, which often pays the lower maker fee, but price can touch a limit without filling it.
What a partial exit does to R
R is the planned loss at the first stop, costs included. A partial exit does not change R. It changes what the trade can pay in R and how much is left at risk.
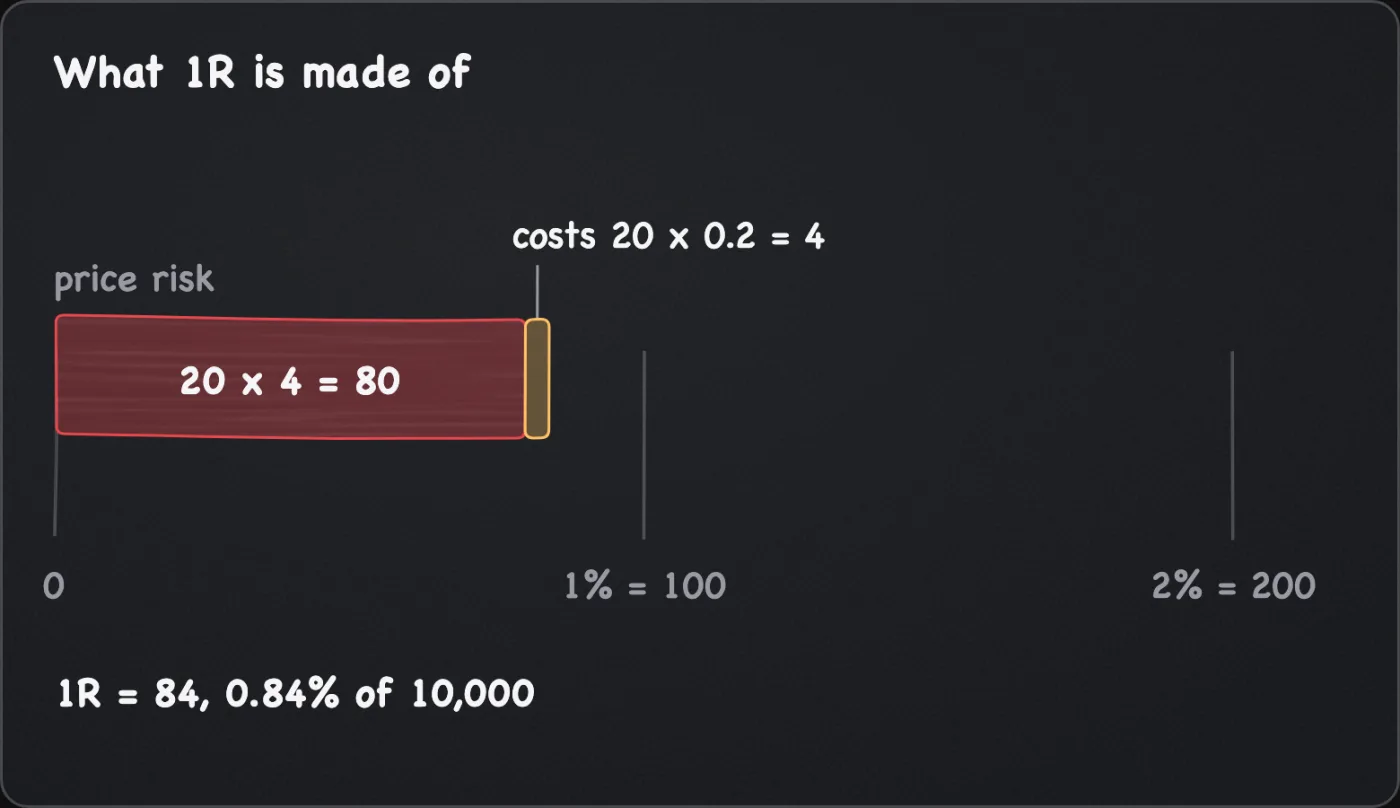
For arithmetic only, assume a long of 20 units at 100 with a stop at 96. Assume each fill costs 0.1 per unit, so a unit that enters and exits pays 0.2. Then 1R is 20 x (4 + 0.2) = 84, which is 0.84% of an assumed 10,000 account, under the 1 to 2% house constraint, a choice and not a recommended allocation, and lower is allowed. Half the position, 10 units, closes at a target of 104. That half banks 10 x (4 - 0.2) = 38, about 0.45R.
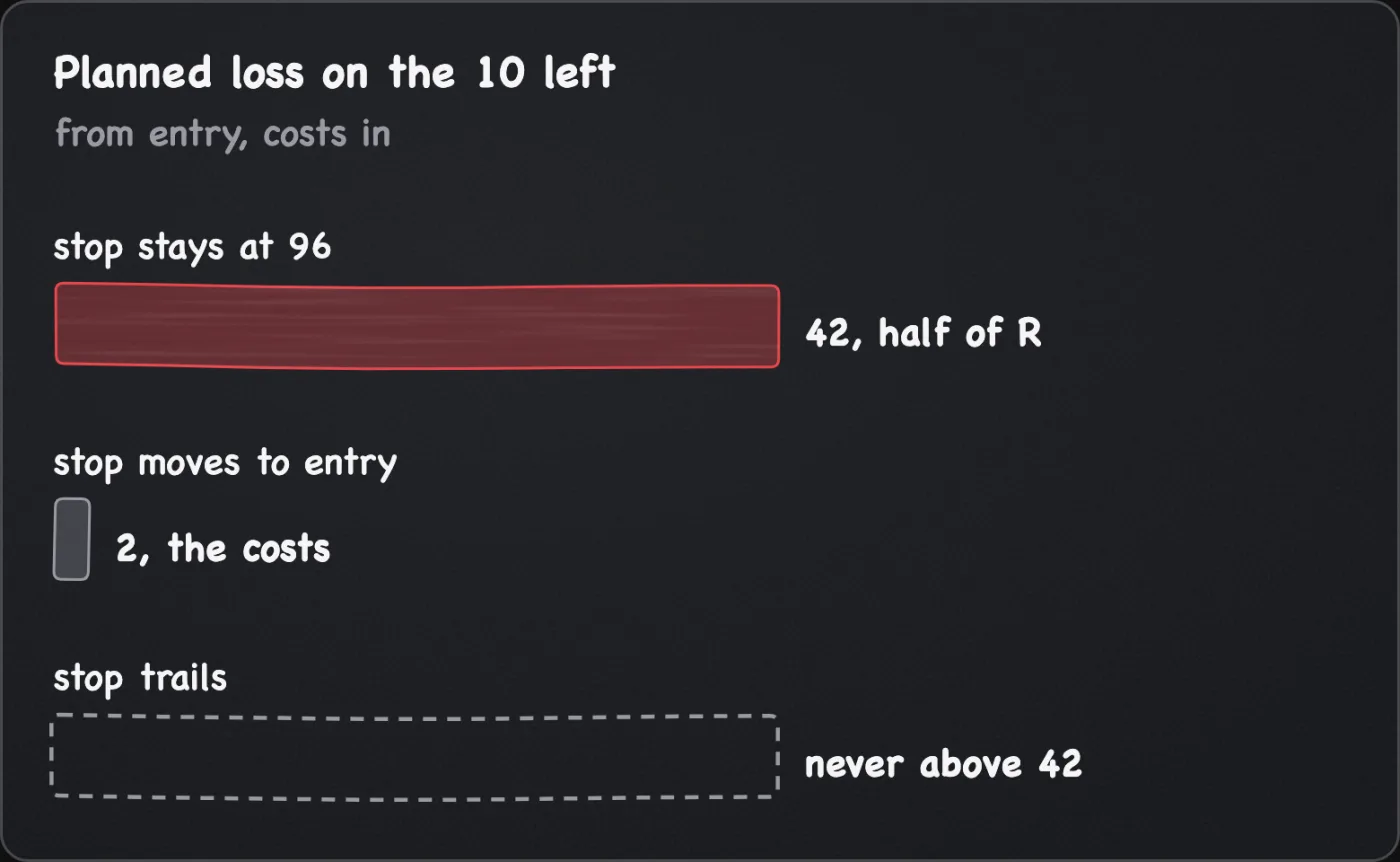
After the partial, 10 units stay open. With the stop still at 96, the planned loss on them, measured from entry, is 10 x 4.2 = 42, half of R. From the target at 104, a fall to 96 would give back 80 gross. With the stop moved to entry the planned loss on them is 10 x 0.2 = 2, the costs alone, if it fills at entry. The table puts the whole trade in R, net of costs.
| What happens to the rest | Net result | R |
|---|---|---|
| Stopped at the original stop, 96 | 38 - 42 = -4 | -0.05 |
| Stopped at entry, 100 | 38 - 2 = +36 | +0.43 |
| Closed at 108 | 38 + 78 = +116 | +1.38 |
| For comparison, all 20 units closed at 108 | 20 x 7.8 = +156 | +1.86 |
| For comparison, no target, stopped at 96 | -84 | -1.00 |
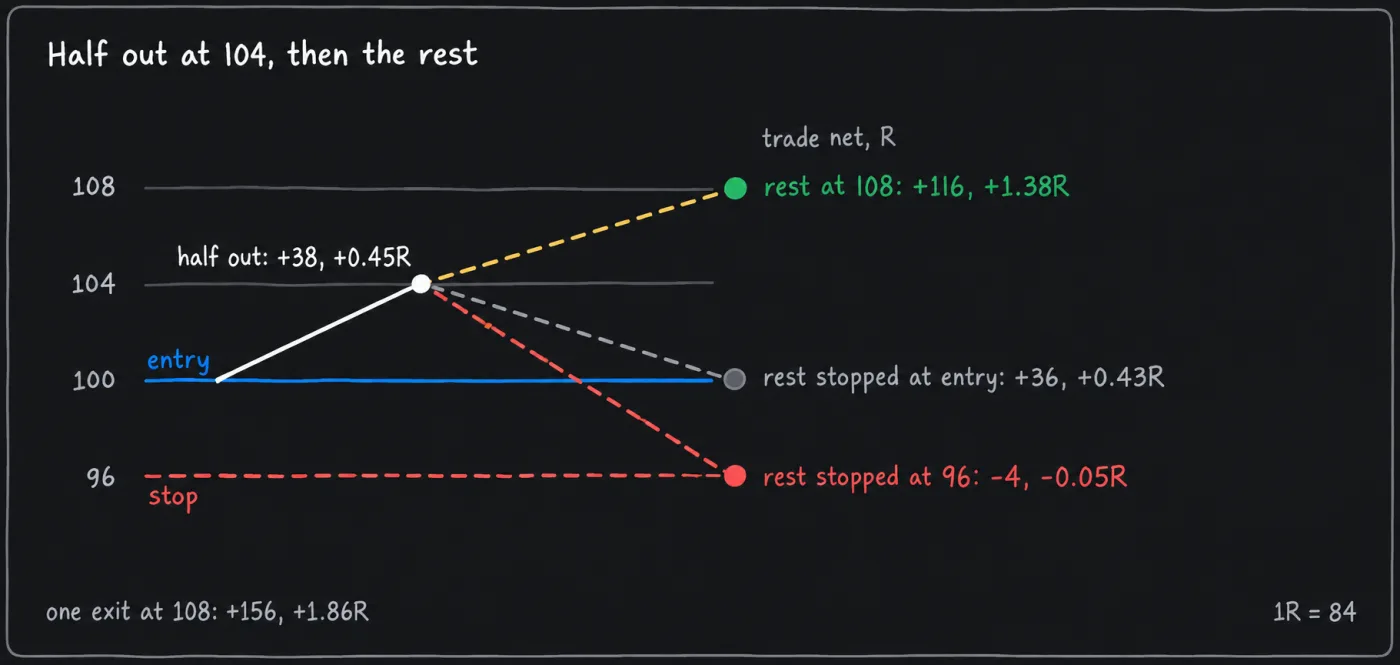
Three things show. The target 8 above entry, which the chart shows as 1:2, a 2R target, pays about 1.86R after costs, as expectancy and drawdown records it. Closing half at 104 and then losing the rest at the original stop is nearly flat, not a loss of 1R. And the partial pays less than the single exit if price reaches 108, and more if price turns back after 104. With the stop at entry, the partial nets +0.43R where the single exit, stop also at entry, nets about -0.05R. At the original stop it nets -0.05R against -1.00R. Whether that mix raises the average result depends on how often each happens, and this page cites no test. Run the arithmetic on your own prices before the trade, since the result moves with the share closed.
The stop on the rest
There are three plans, written before entry. The stop stays where it was, so the loss on the rest is still its planned share. It moves to entry, which caps the rest at the costs, but entry is a price the market just traded, so an ordinary pullback can reach it. Or the stop trails, as in the Chandelier Exit trend ride. A stop only moves toward price, so none of the three raises the planned loss, though fees, funding and gaps can still make the realised result worse.
Orders and fees on each exit
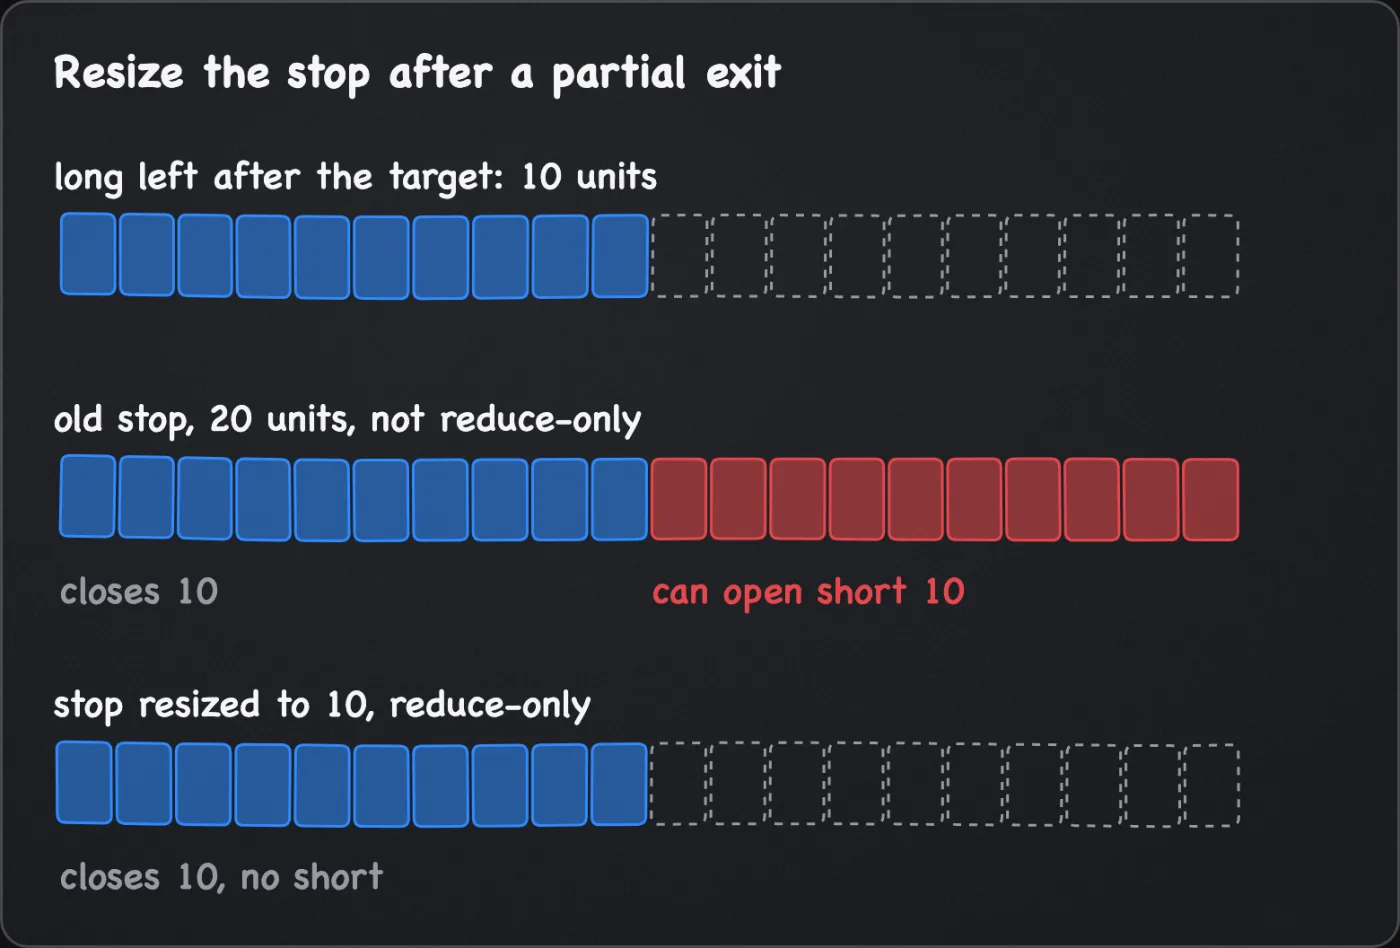
Targets and stops that close part of a position should be reduce-only. If a stop still holds the old quantity after the target fills, a stop for 20 units on a position of 10 can open a short of 10 where reduce-only would not. Some exchanges resize, reject or cancel an oversized reduce-only order, and behaviour varies with the position mode, so order types and the exchange's help pages decide. Resize the stop to the units left, and if a target fills only in part, to what is still open.
Every exit can fill in pieces, and each fill pays its own fee, charged on the value closed. Splitting an exit pays about the same percentage, but the order type changes it: a limit target may pay the maker rate and a stop-market commonly pays the taker rate. Log the fee on each fill, and count the total against the cost allowance and the one-fifth cost line in the risk limits. Each part must also be at least the exchange's minimum order, so a position too small to split gets one exit.
Default settings
This page cites no published default for taking profit, so the table lists the reference values this manual uses.
| Item | Value | Status and limitation |
|---|---|---|
| Target price | The next real level in the trade's direction, set before entry | This manual's choice. A level can fail or hold, and the target says nothing about which. |
| Share closed at the first target | Set in the plan; the examples assume half of the open position | Illustrative assumption, not a recommendation. A larger share banks more and leaves less running. |
| Stop on the rest | Stays, moves to entry, or trails; it moves toward price only | This manual's choice. Entry as the stop gives up room. |
| Exit orders | Reduce-only; target as a limit, stop as a stop-market | This manual's choice. A limit may not fill, and a stop-market can slip. |
| Fees | Logged for every fill and counted against the cost allowance | This manual's choice. |
| Variation: single exit | All out at one target | The simplest plan, and it leaves nothing running. |
| Variation: trail only | No target; a trailing stop does the exiting | See the trend ride page. It gives back about the trail's distance from each peak, and that distance moves with ATR. |
How it is used in this manual's setups
Every setup writes its exit before entry, as the rules checklist asks: a target at a price, or a trail. The ending diagonal breakdown sets Fibonacci levels for an early partial and two main targets, then moves the stop and trails the rest, which are the pieces on this page. Pick one scheme and use it for enough trades to judge it. The count is this manual's floor from testing a setup, at least 100 signals taken and recorded in R, a floor and not proof.
Common mistakes
- Choosing the target to fit the ratio. Put it at the next real level and accept the ratio that results.
- Treating a stop at entry as free. It sits where price just traded, so a retest can stop the rest for the costs.
- Leaving the old quantity on the stop after a partial exit. Resize it, reduce-only, to what is open.
- Changing the scheme after each trade. A scheme swapped after a result is fitted to that result.
- Ignoring the fee on each fill. Add every one to the journal, or the net R is wrong.
What this cannot tell you
- Whether a scheme raises expectancy. The table shows how a partial exit moves the result between outcomes. It cannot say how often each outcome occurs, and this page cites no test of any target scheme.
- Whether price reaches the target. A touch is not a fill, and a level can fail.
- What price does after you exit. A target that fills before a run leaves gain unused, and one that is missed before a reversal leaves it unbanked. Neither judges the plan.
- The realised result in a fast market. The arithmetic assumes every fill at its price with a fixed cost, and a gap or a thin book breaks both.
Questions
How much should I close at the first target?
No figure is correct in general. The examples here use half, and the choice is a trade-off between banking more and leaving more running. Write it in the plan, then test it as testing a setup describes.
Should I move my stop to break-even after taking profit?
It limits the planned loss on the rest to its costs, though a gap or slippage can fill it worse, and the stop sits where price just traded. This page names no default. Choose one of the three stop plans before entry and keep it.
Is it better to take profit early or let a trade run?
Neither is better in general. Taking it early banks the gain and may leave a run unused. Letting it run leaves the gain open and may return it. A record of your own trades is the only way to compare.